Using Browsium Client (Proton) Manager
The Browsium Client Manager is the front-end for Proton data reporting. The Manager also provides basic administrative tools for managing Proton clients’ reporting behavior.
Dashboard
Section titled “Dashboard”The Browsium Client Manager’s default view is the dashboard, which provides a high-level view of the latest data collected by Proton clients in the organization. By default, the charts will update in real time so long as the ‘auto refresh’ option remains selected. There are 3 main elements to the default Dashboard view: the navigation ribbon on the left side, the controls bar along the top, and the chart view in the middle.
[]{#_Dashboard_Navigation .anchor}
{width=“6.462123797025372in” height=“3.2448162729658794in”}
Dashboard Navigation
Section titled “Dashboard Navigation”Users and administrators can navigate through the Manager via this navigation ribbon. Click on any line to change the Chart View to the desired view. The navigation ribbon can be collapsed or expanded by clicking on the ‘hamburger’ button in the control bar:
{width=“1.7291666666666667in” height=“0.4375in”}
The following screenshots show the nagivation ribbon’s default view and collapsed view for Proton for each user type.
Administrator Power User *User*
 {width=“1.1117836832895889in” height=“3.2516327646544183in”}
  {width=“0.4049879702537183in” height=“3.4588353018372704in”}
 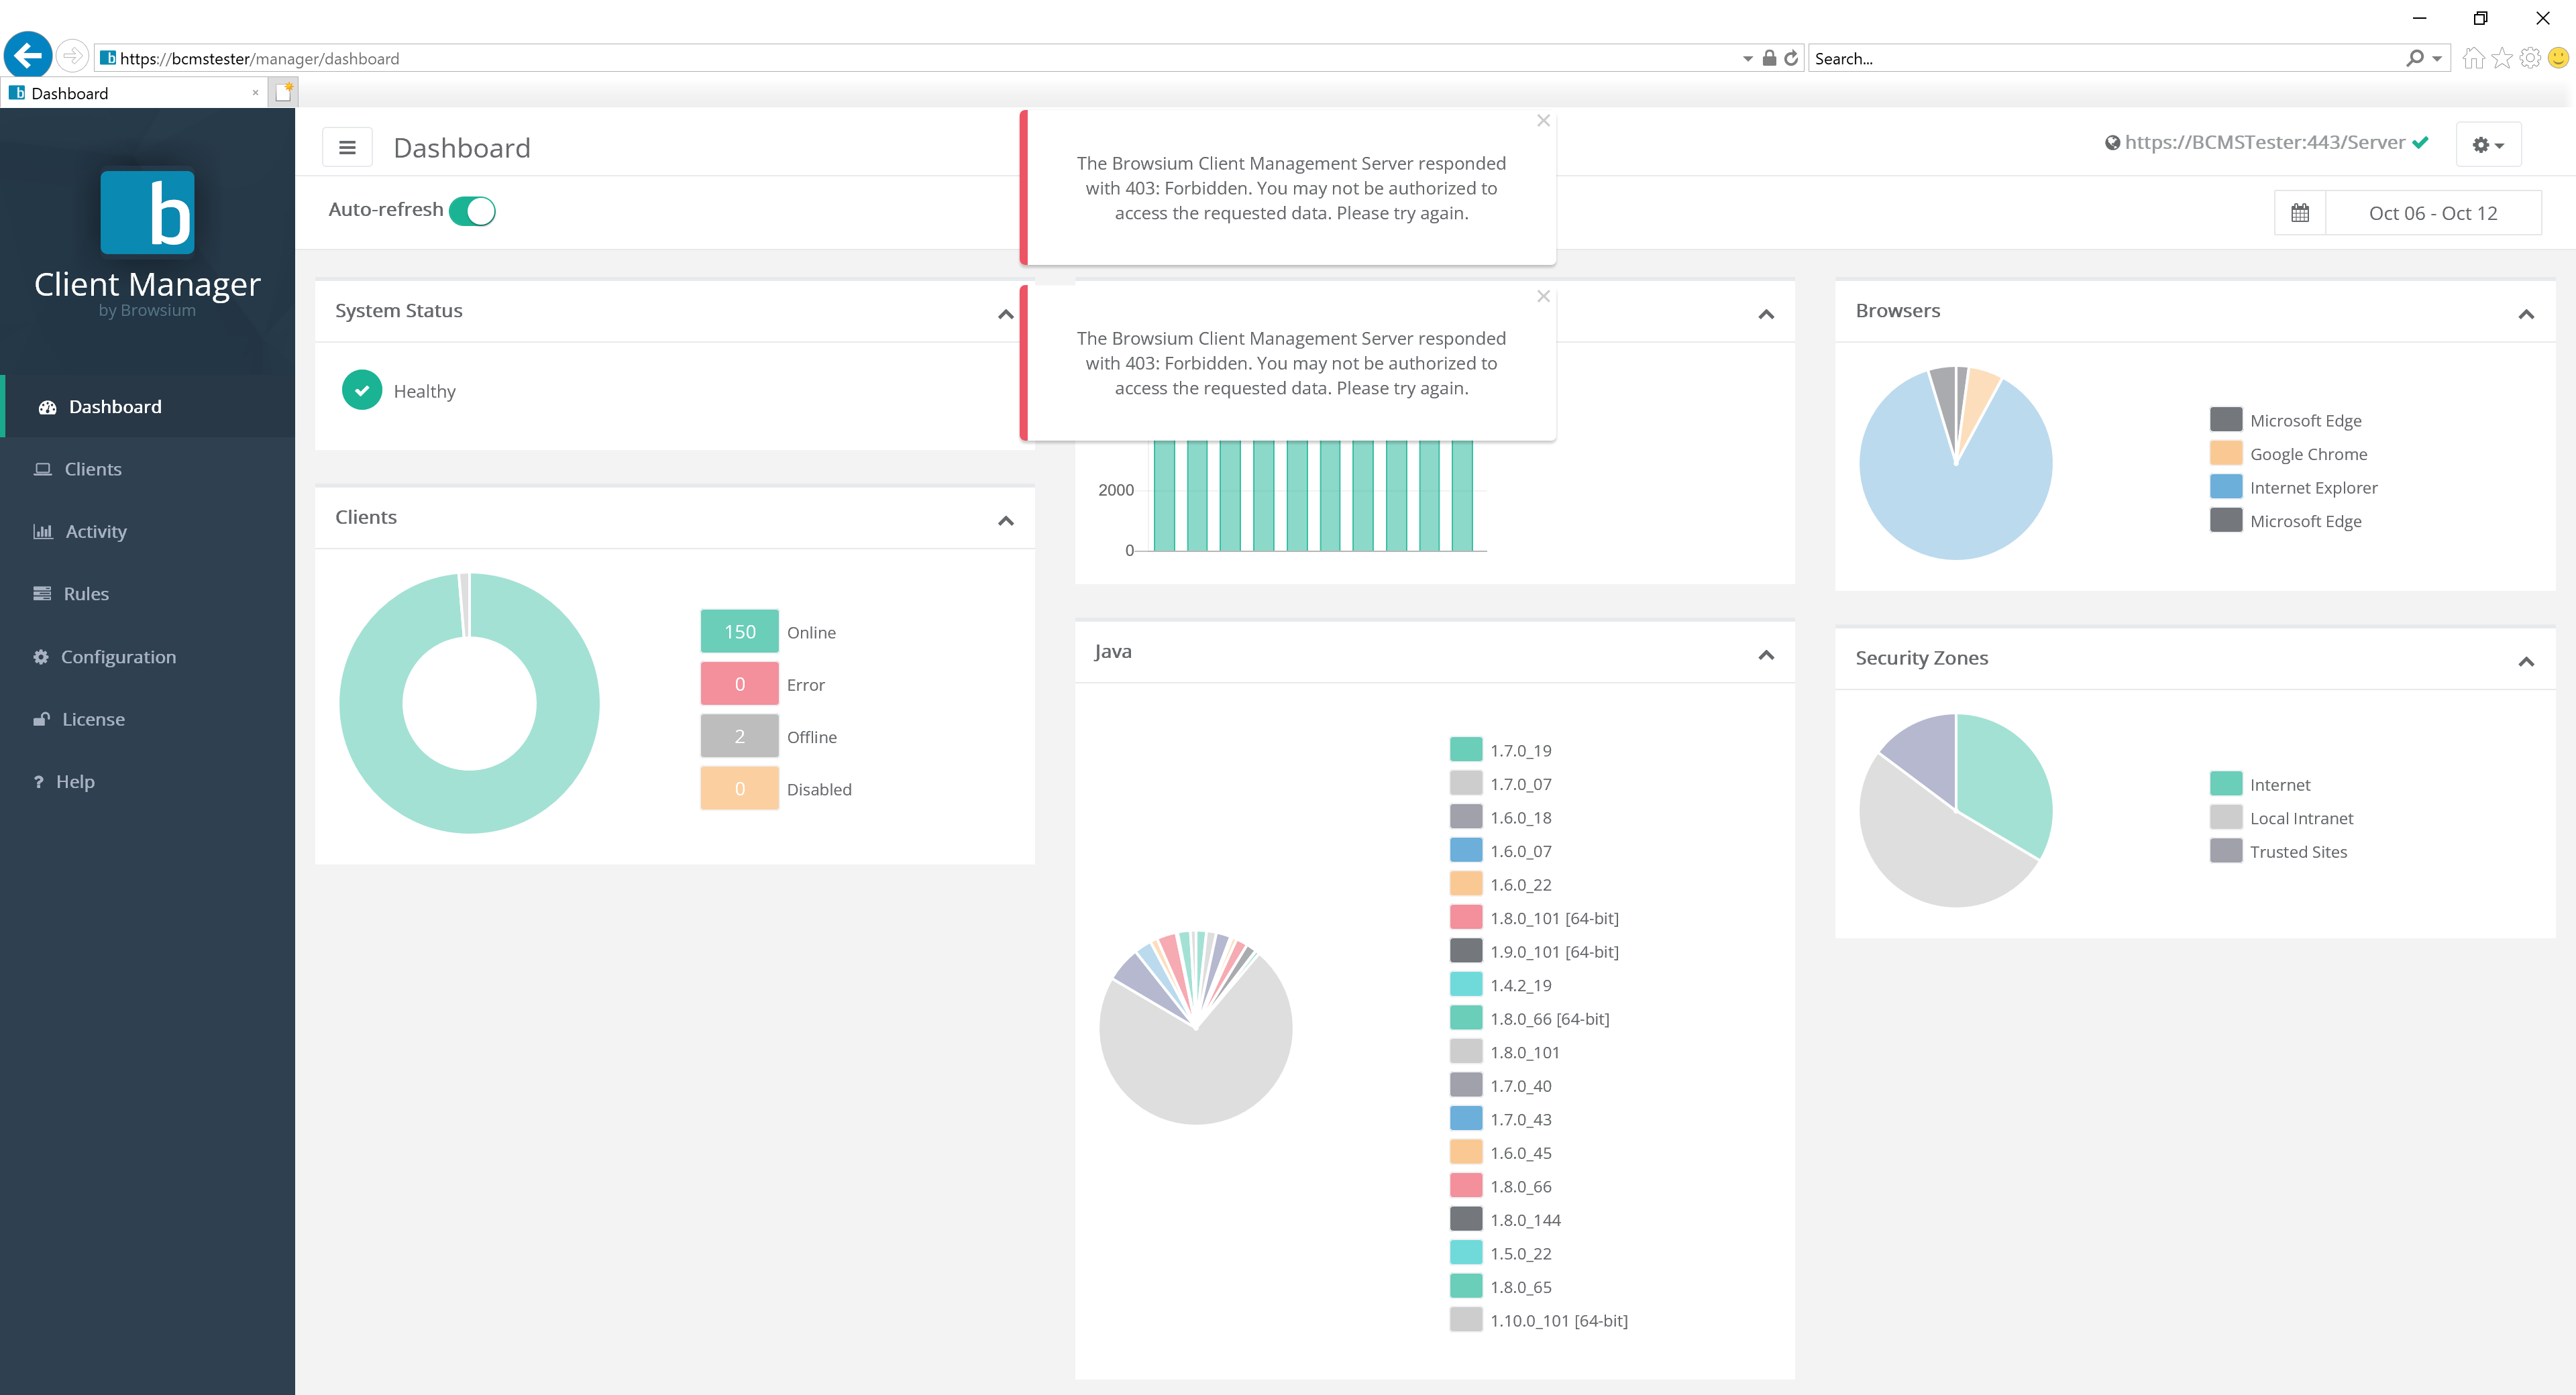 {width=“1.1785378390201224in” height=“2.910703193350831in”}
 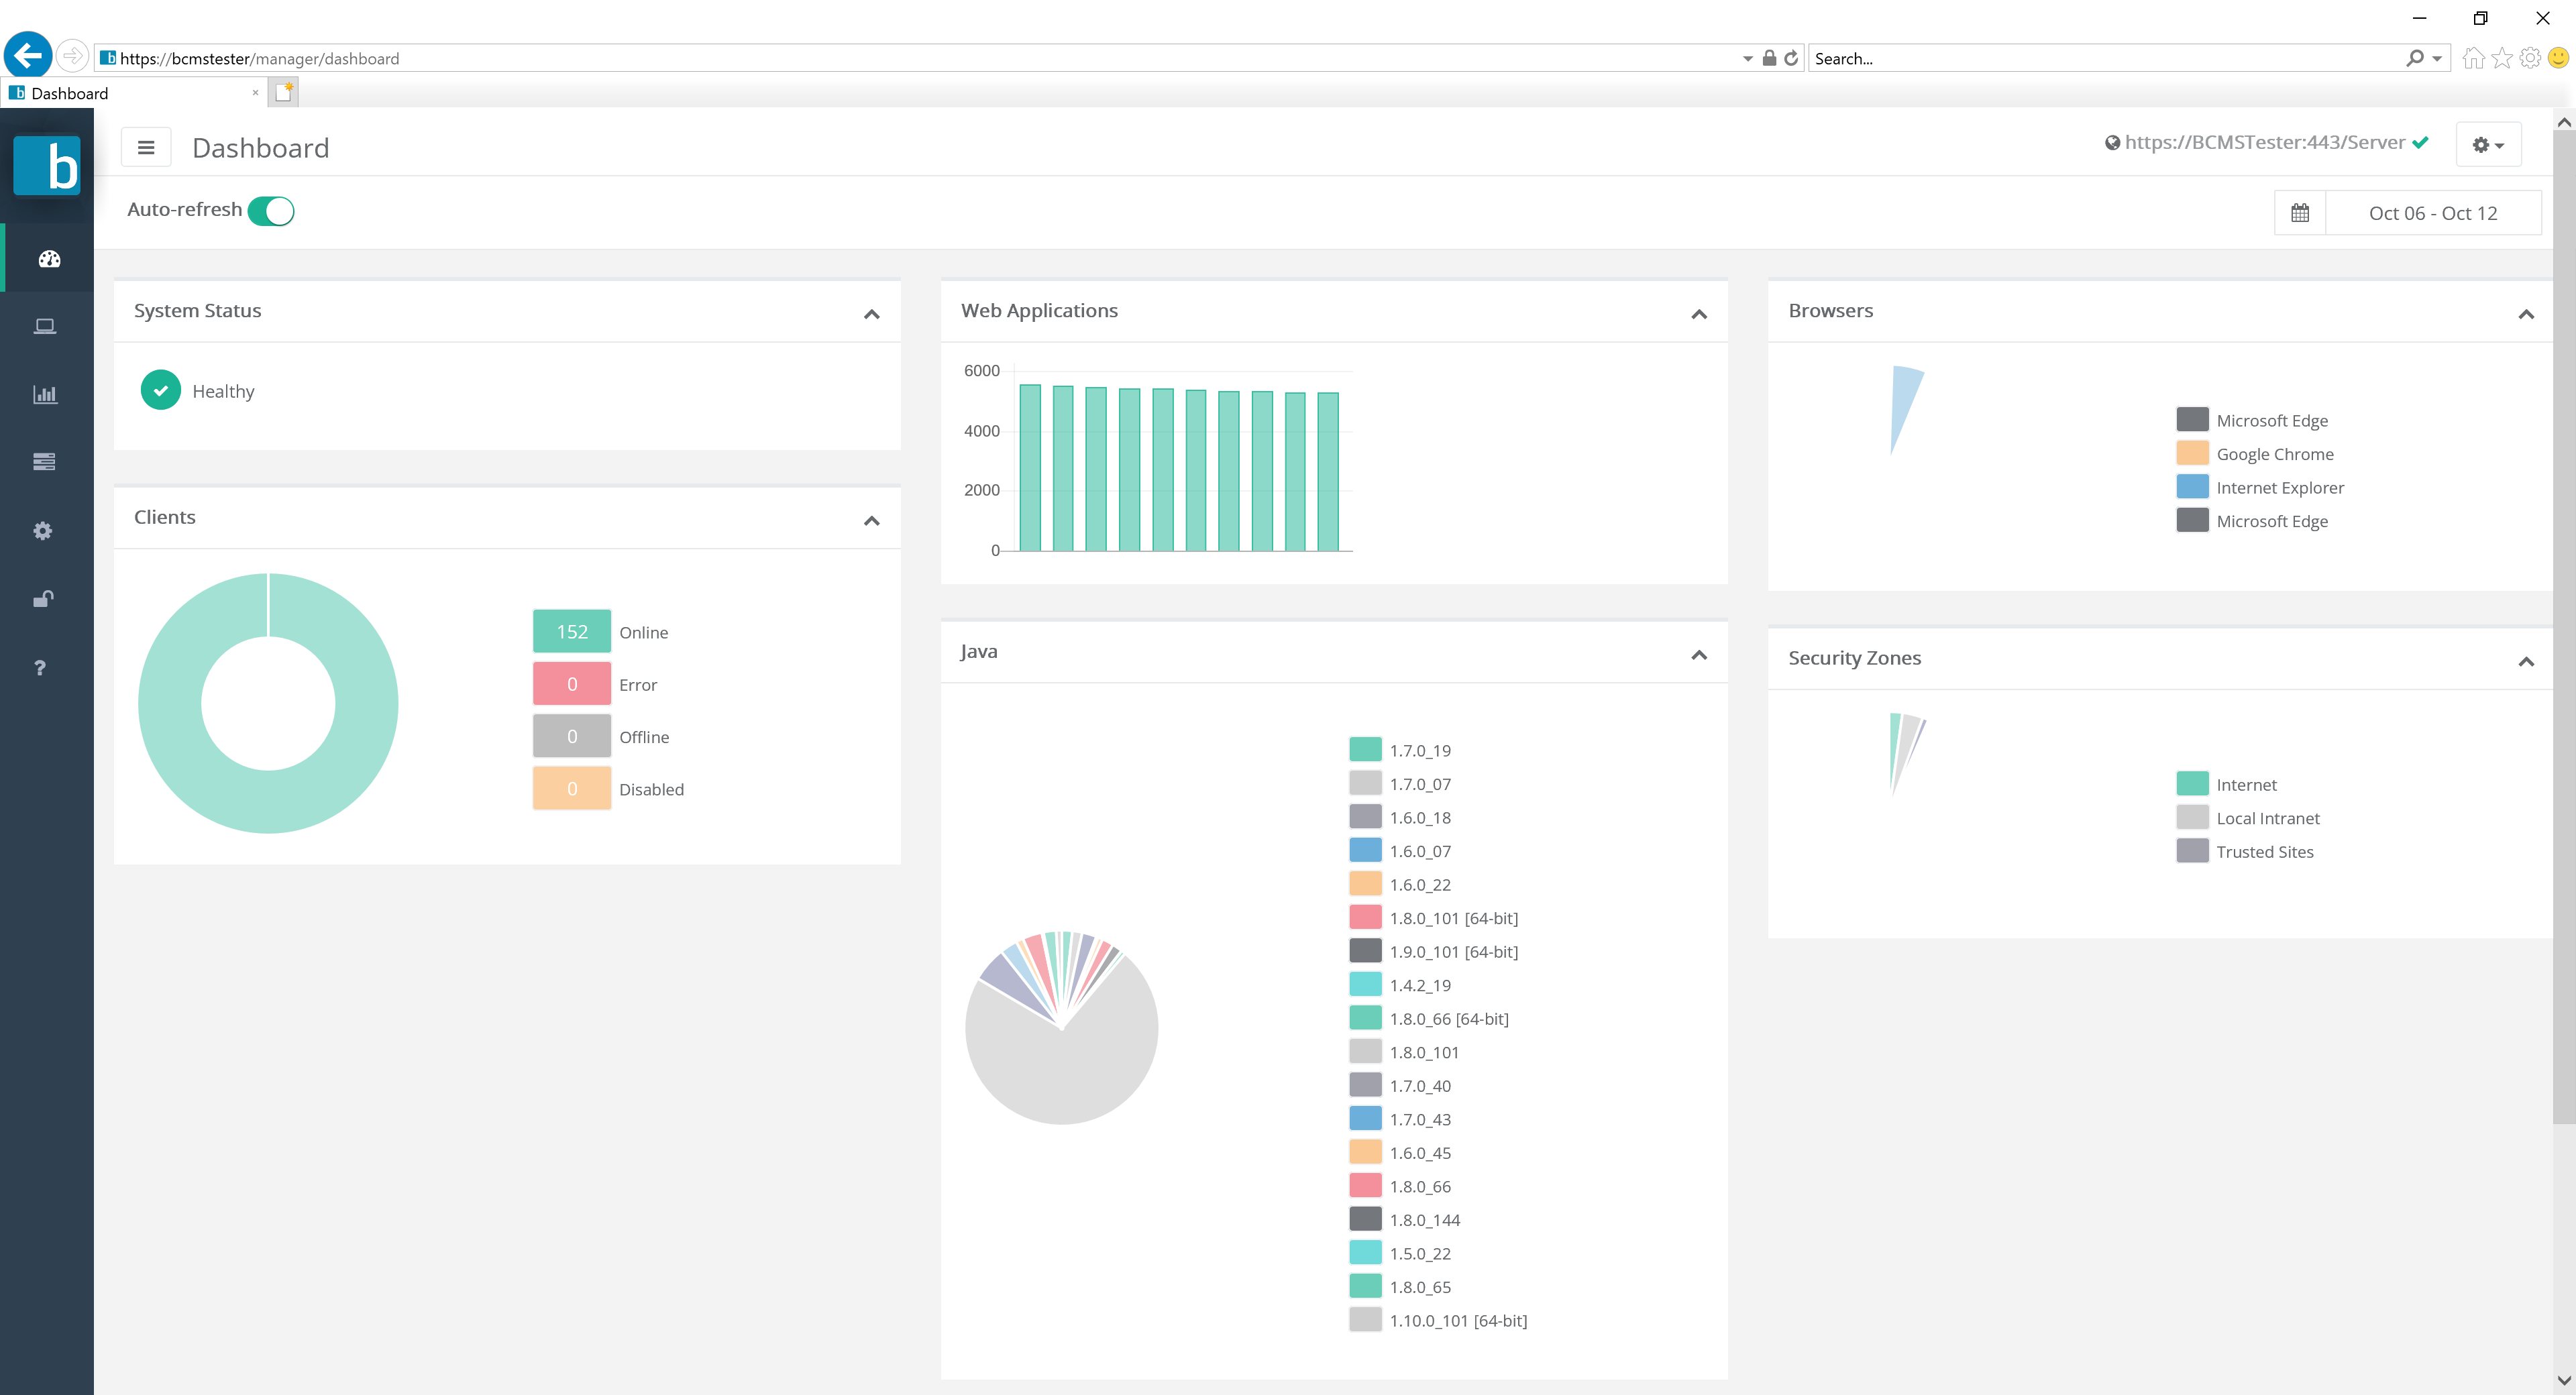 {width=“0.42136811023622045in” height=“2.918847331583552in”} {width=“1.1785378390201224in” height=“2.910703193350831in”} {width=“0.42136811023622045in” height=“2.918847331583552in”}
Each of the options available in the navigation panel will be discussed in detail below. Proton Administrator accounts have access to view and modify three pages — Users, Privacy, and Diagnostics — which non-administrative users will not see. Power Users have access to view and modify the Configuration and Rules pages while (standard) Users can only view these pages in read-only mode.
Controls Bar
Section titled “Controls Bar”The Controls Bar contains a variety of links and controls for Browsium Client Manager.
The ‘hamburger’ control ( {width=“0.4158202099737533in” height=“0.3261679790026247in”}) will collapse or expand the left-most Navigation bar.
The server URL (https://BrowsiumDemo/Server in the screenshot above) shows which BCMS server the Manager is currently connected to.
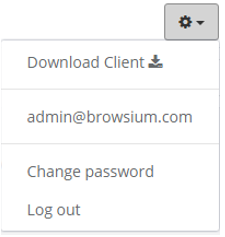
The settings control ( {width=“0.39291447944006996in” height=“0.272911198600175in”}) provides access to advanced features including downloading the Browsium Client, changing the password for the user currently logged into the Manager, and logging out of the Manager. Use Log out to connect to a different Proton server.
 {width=“1.8576870078740157in” height=“1.9567639982502187in”}
User accounts and passwords are stored in the Proton server (in the database), not in the Manager. The Manager application can be used to log into various Proton servers, but only one Proton server database can be accessed each browser instance. Use the browsers private browsing mode to access multiple Proton server databases simultaneously in multiple windows.
If the ‘Auto-refresh’ button is enabled, then any data updates made by active Proton clients will be automatically reflected in the current view (charts and graphs will update automatically when new data is uploaded and processed).
The date picker control allows you to select a date range, in UTC time, to filter Proton data in the current view. The date picker will automatically compute {Today} and {Yesterday} and replace them with month and day. Note that any given date in UTC time may be different than the date in your local time zone.
{width=“1.3121325459317585in” height=“2.373254593175853in”}
{width=“4.024459755030621in” height=“2.3230949256342956in”}
The following table provides the details on what you will see for each date picker selection.
Selection Description
{Today} Only data collected since 12:00 midnight UTC will be shown
{Yesterday} Only data collected between 12:00 midnight and 11:59pm UTC the day before will be shown
Last 7 Days All data collected in the previous 7 days (including today) will be shown. This is the default data filter for Proton
Last 30 Days All data collected in the previous 30 days (including today) will be shown
This Month Only data collected since the 1^st^ of the current month will be shown
Last Month Only data collected during the previous month will be shown
Custom Range Allows the administrator to designate custom start and end dates for the view
Section titled “Custom Range Allows the administrator to designate custom start and end dates for the view”Once a date range is selected, the Chart View will update automatically to display only data from the user’s selection.
Chart View
Section titled “Chart View”The Chart View area displays the data currently selected by the navigation ribbon. By default, the Dashboard shows a high-level summary from all Proton clients per the date range selected in the date picker. This page is useful for seeing at-a-glance the breadth of connected Proton clients and their installed software (Java, Browsers, etc.).
Clicking on any graph or header will navigate the user to the appropriate page to drill in to further details.
These ‘widgets’ can be reorganized or collapsed for user preference. Look for additional widgets to be added in future releases.
Clients Section
Section titled “Clients Section”The Clients section of the navigation bar provides access to detailed client data for the PCs connected to your Proton server. The five sub-pages provide client connectivity and inventory information for Status, Java and ActiveX.
 {width=“1.5039074803149606in” height=“3.2582764654418197in”}
Status
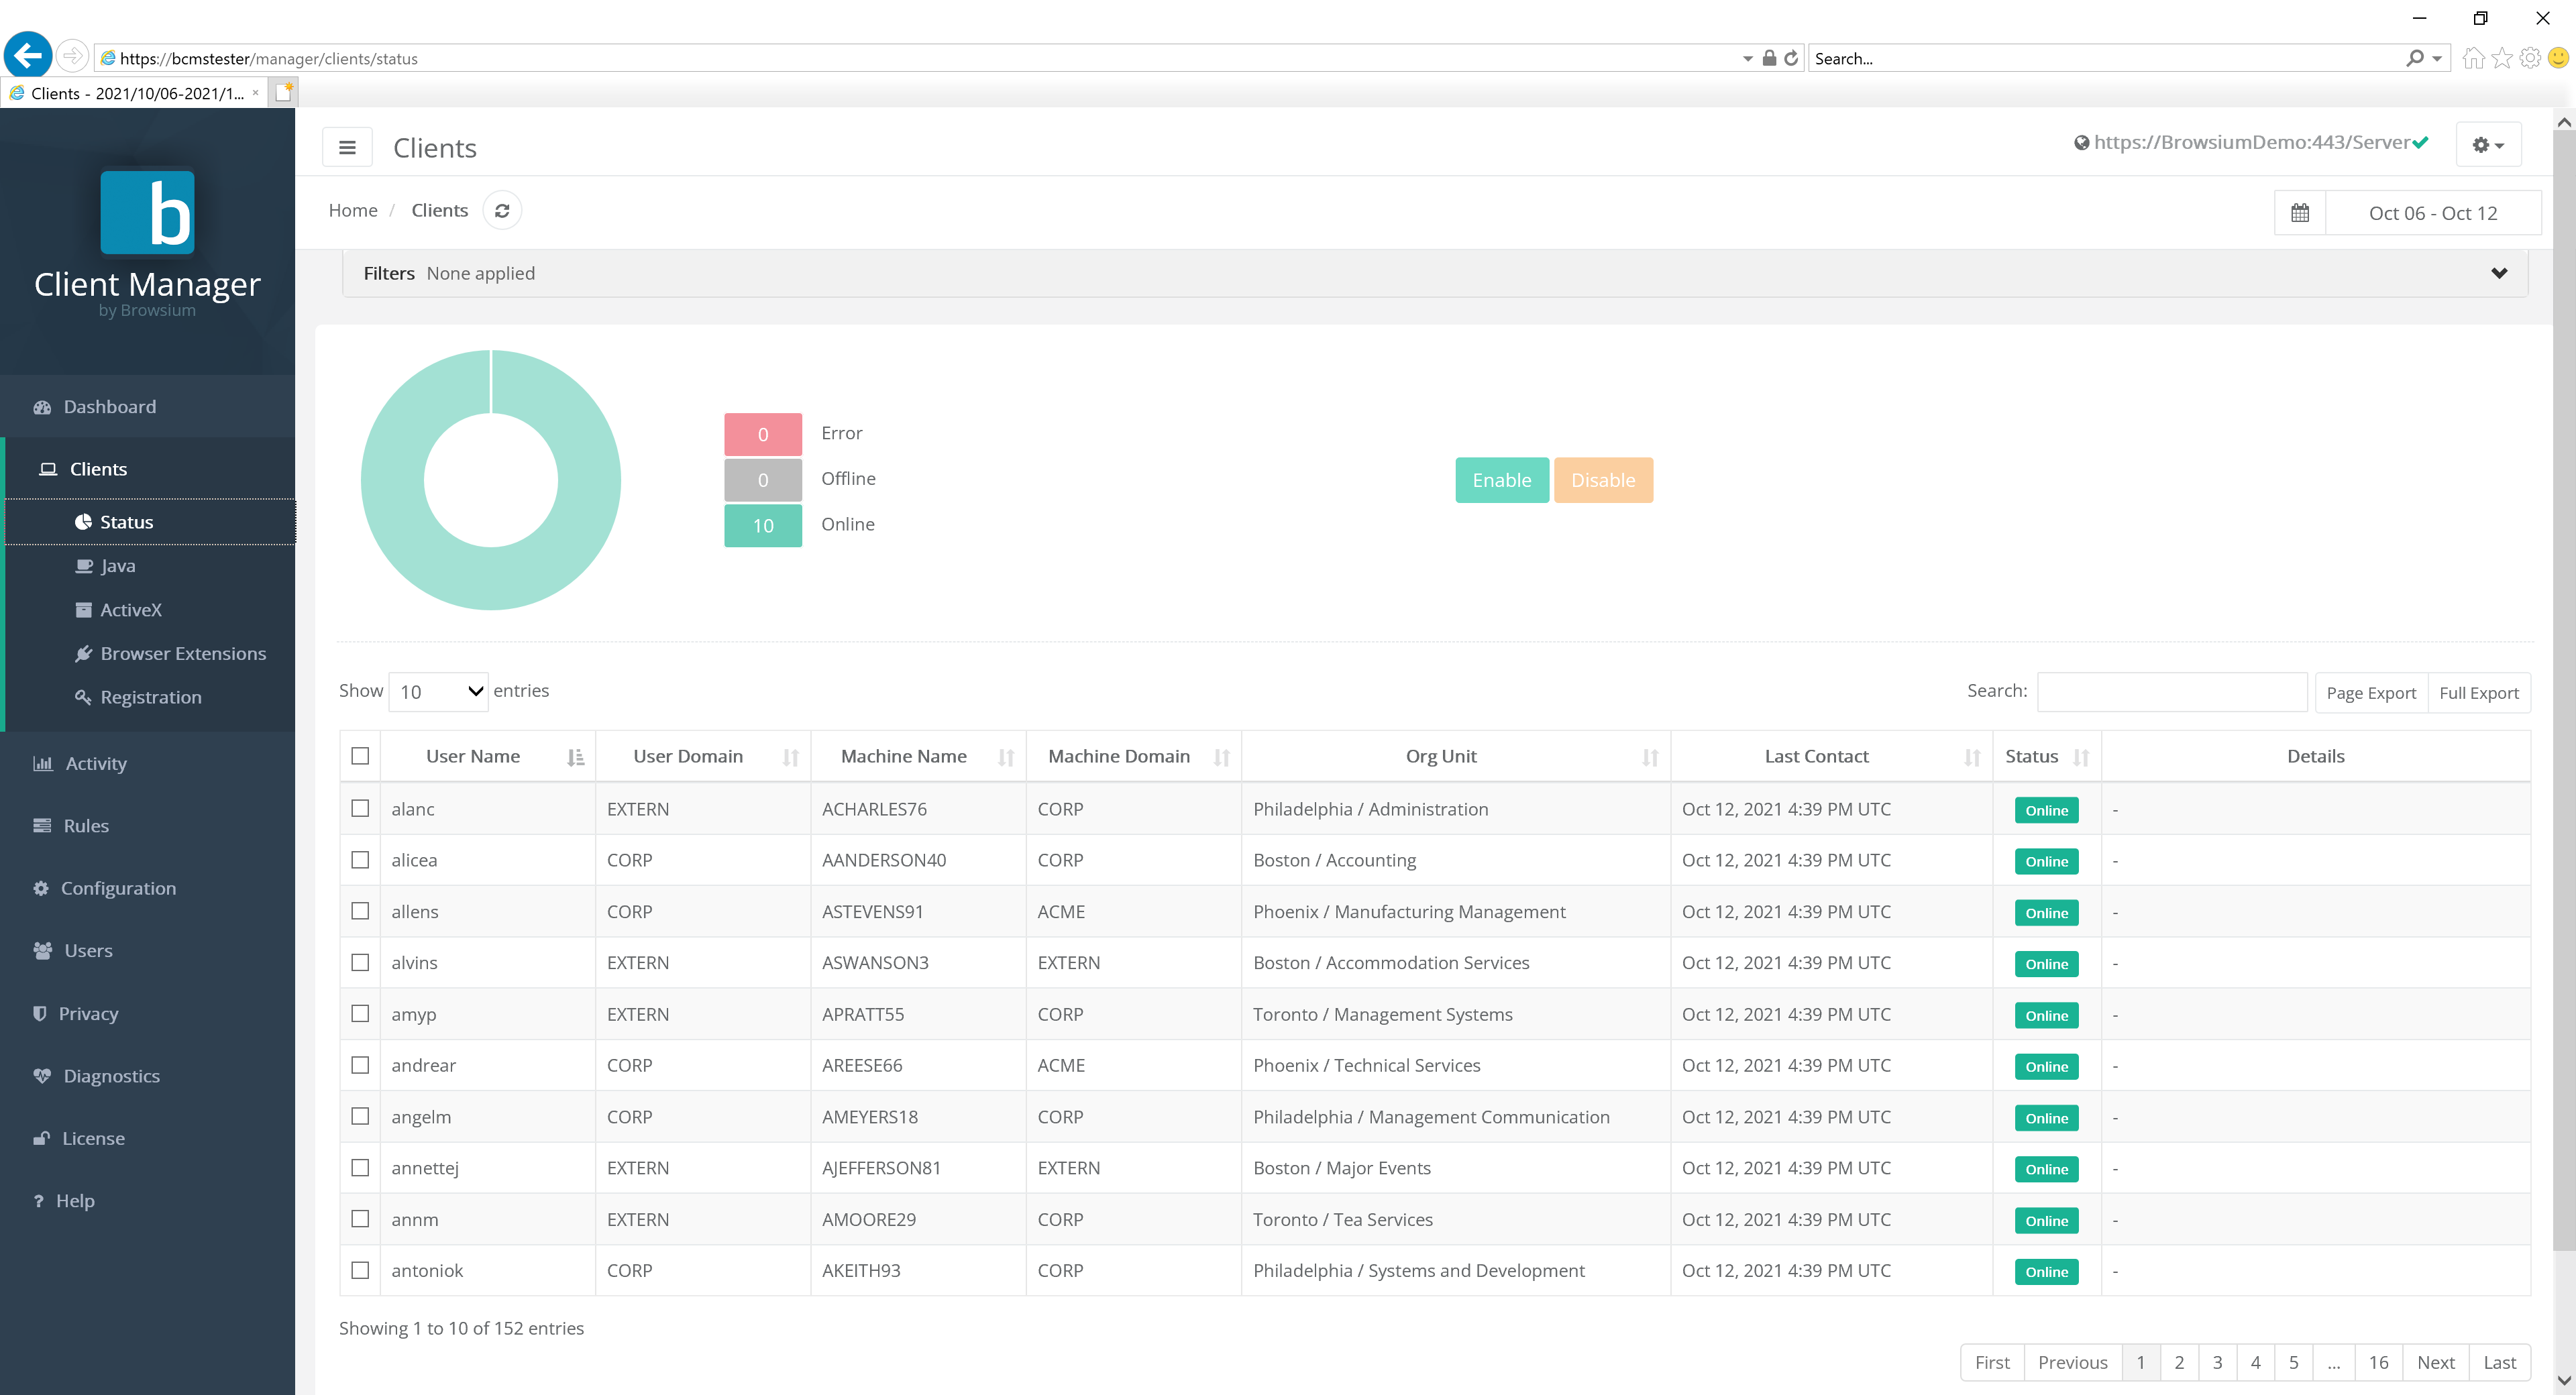
Section titled “Status”The Status page will display all Proton clients that are, or have, connected to the server.
You can narrow the list of clients by typing search criteria into the search bar
To disable data collection from a specific client, check the box next to it in the list and click the ‘Disable’ button. This will prevent that client from uploading any data in the future. Note that existing data already uploaded by that client will remain and will not be removed or filtered. Client data upload can be re-enabled by selecting the appropriate clients and selecting ‘Enable’.
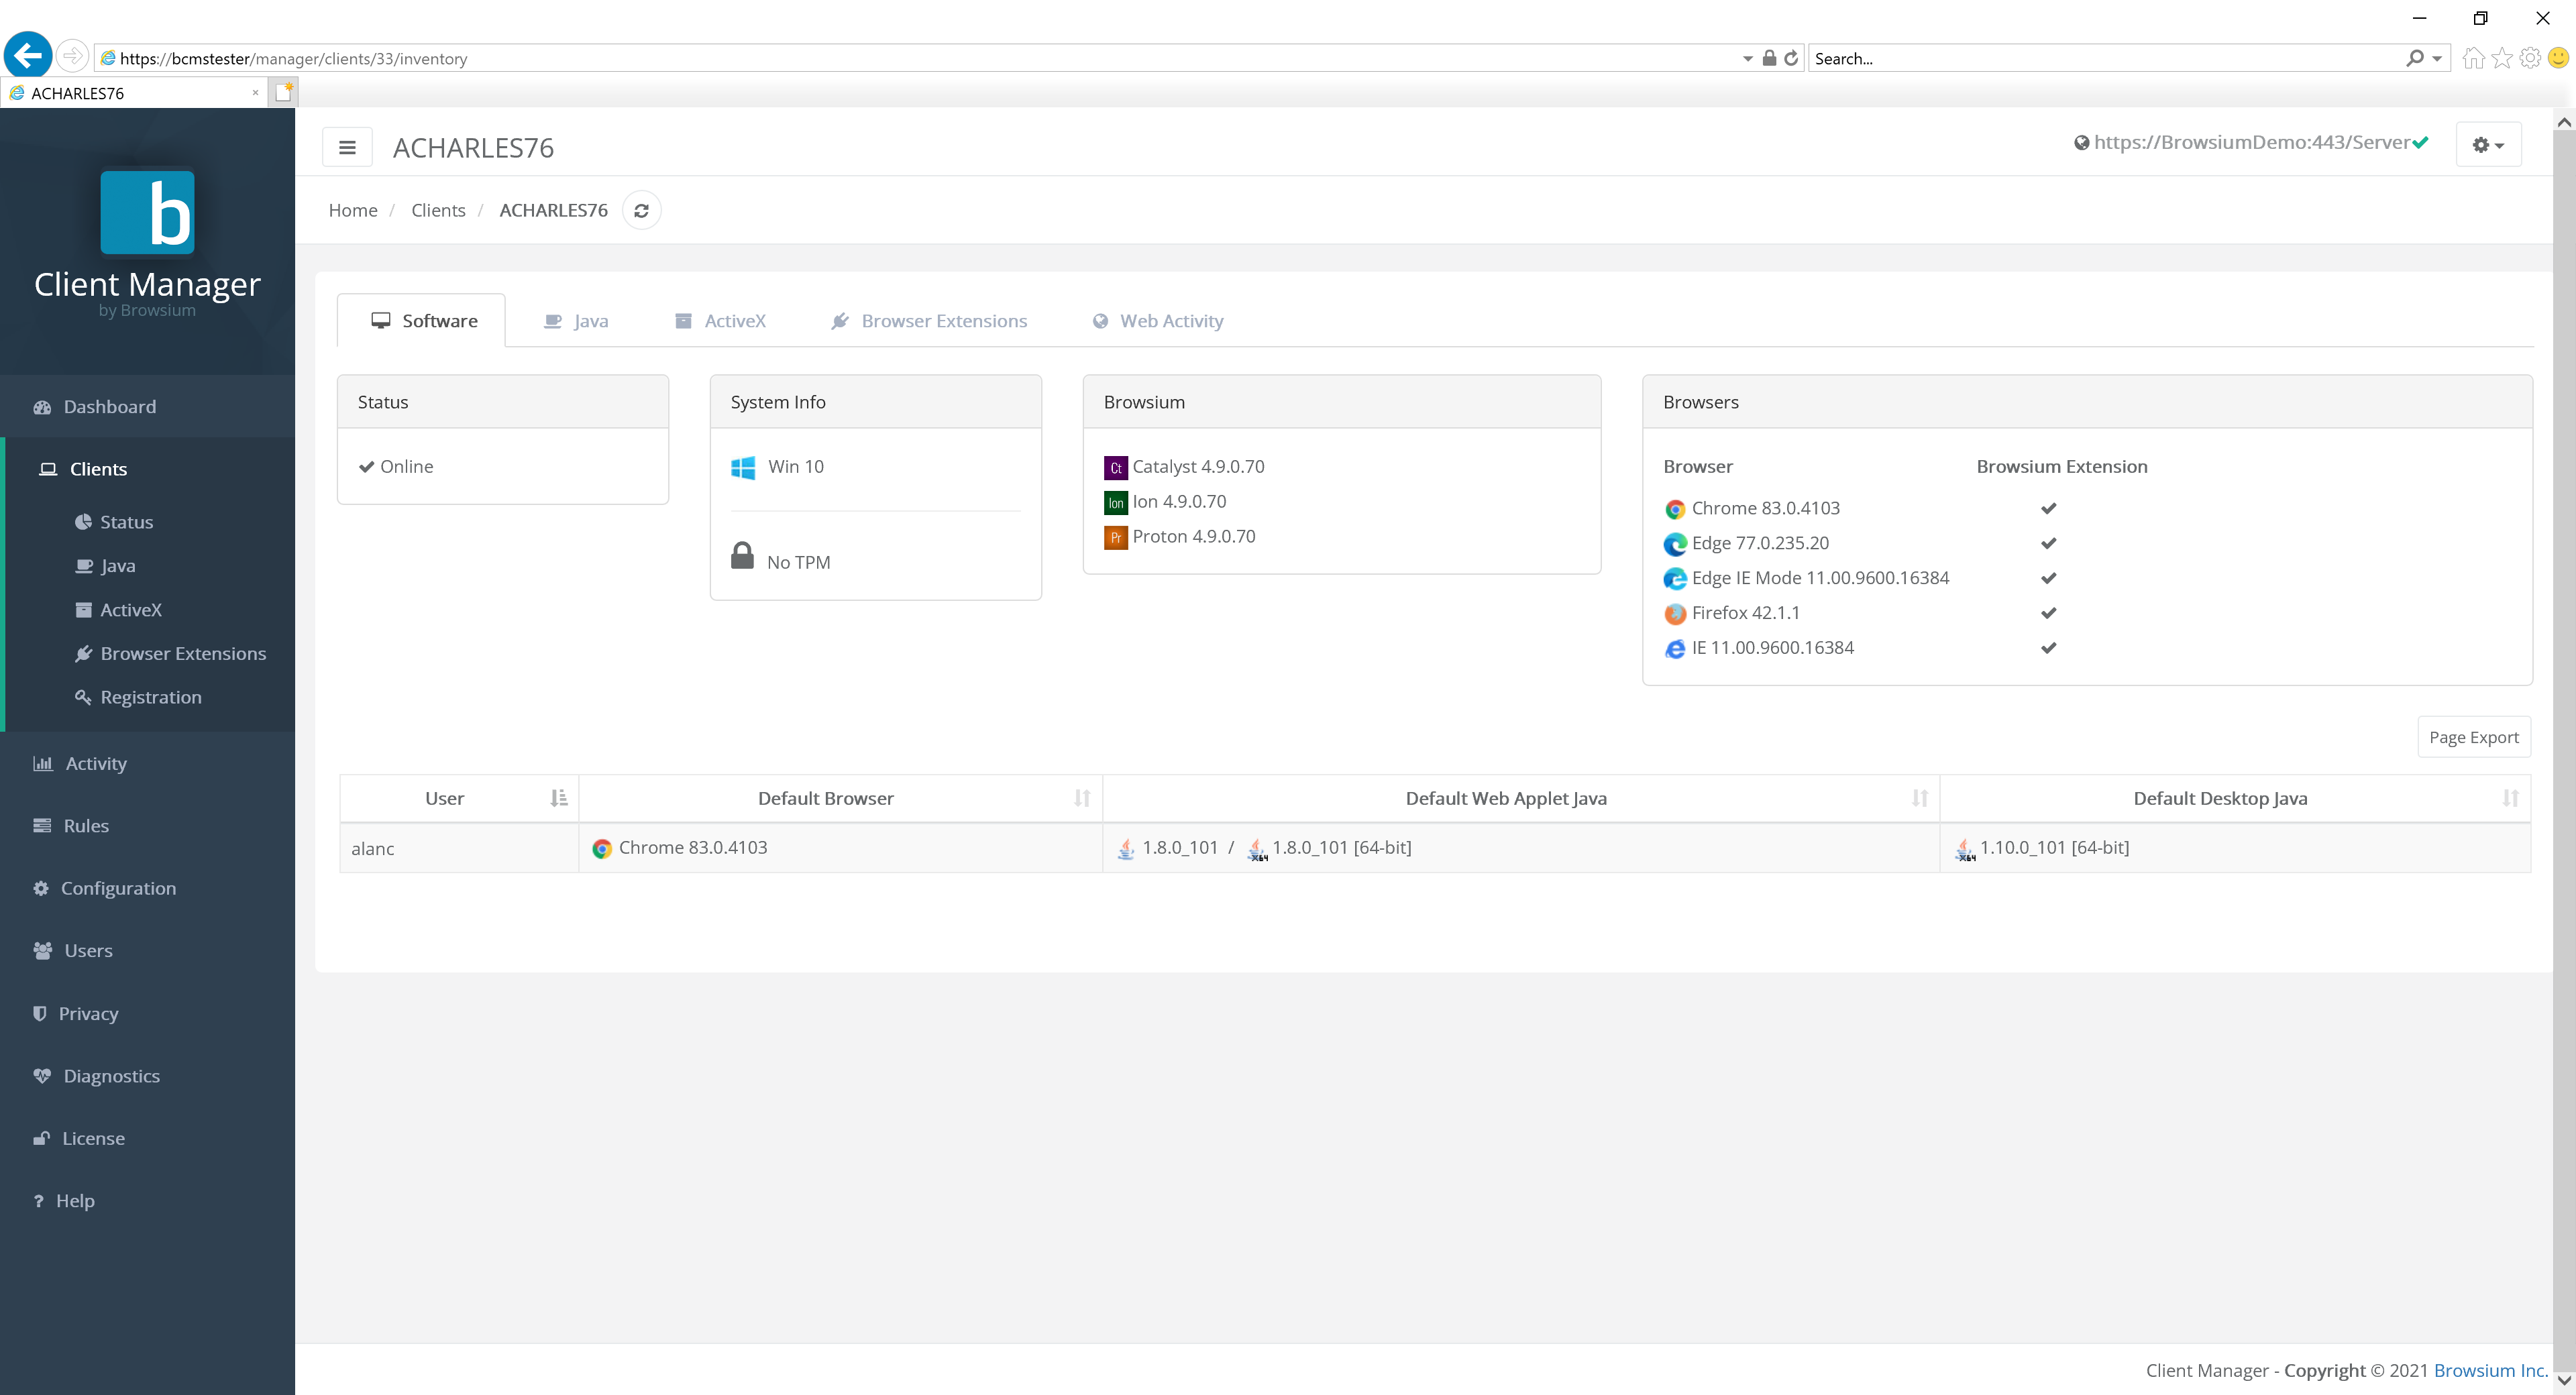
For a full report on a specific client, click it from the list to see a summary view of installed software, with access to additional information via the Java, ActiveX, Browser Extensions and Web Activity tabs. The following screenshot provides an example of a client running Windows 10 with a collection of browsers installed. This client has all the Browsium modules active and Browsium extensions enabled.
 {width=“6.001953193350831in” height=“2.3603871391076114in”}
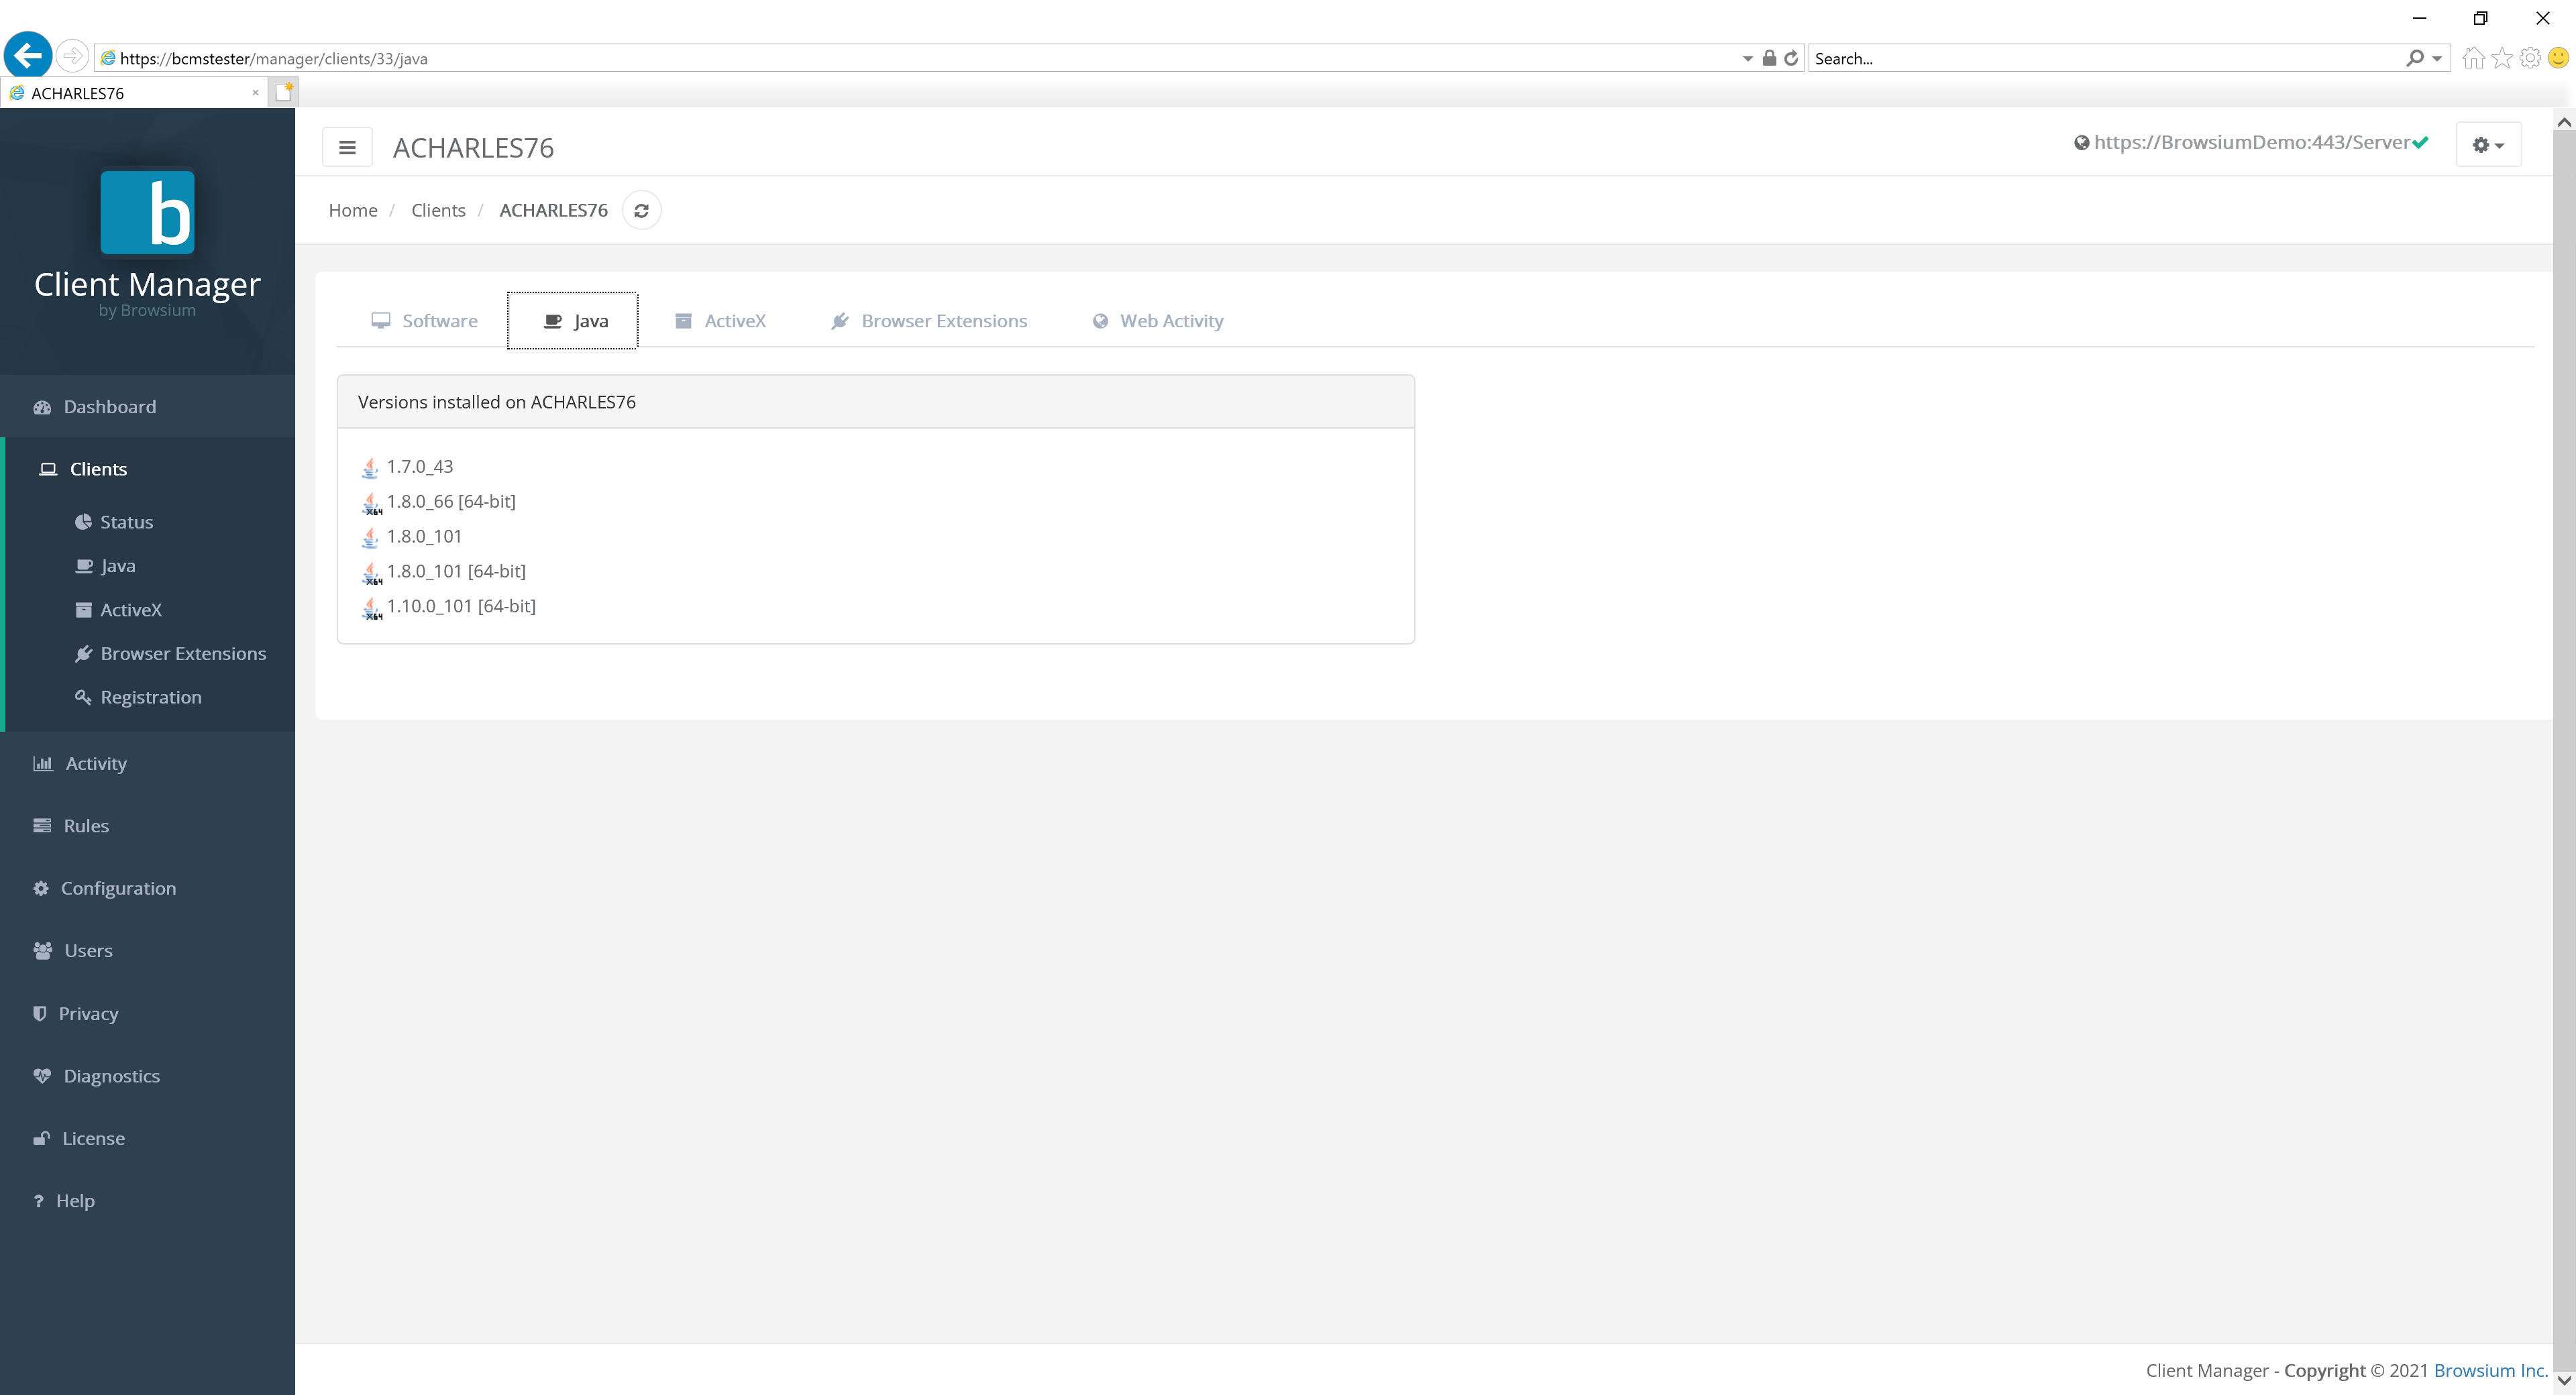
The Java tabs shows us the versions of Java installed on this client.
 {width=“5.0696106736657915in” height=“2.4671062992125985in”}
The ActiveX tabs shows the ActiveX controls installed on this client.
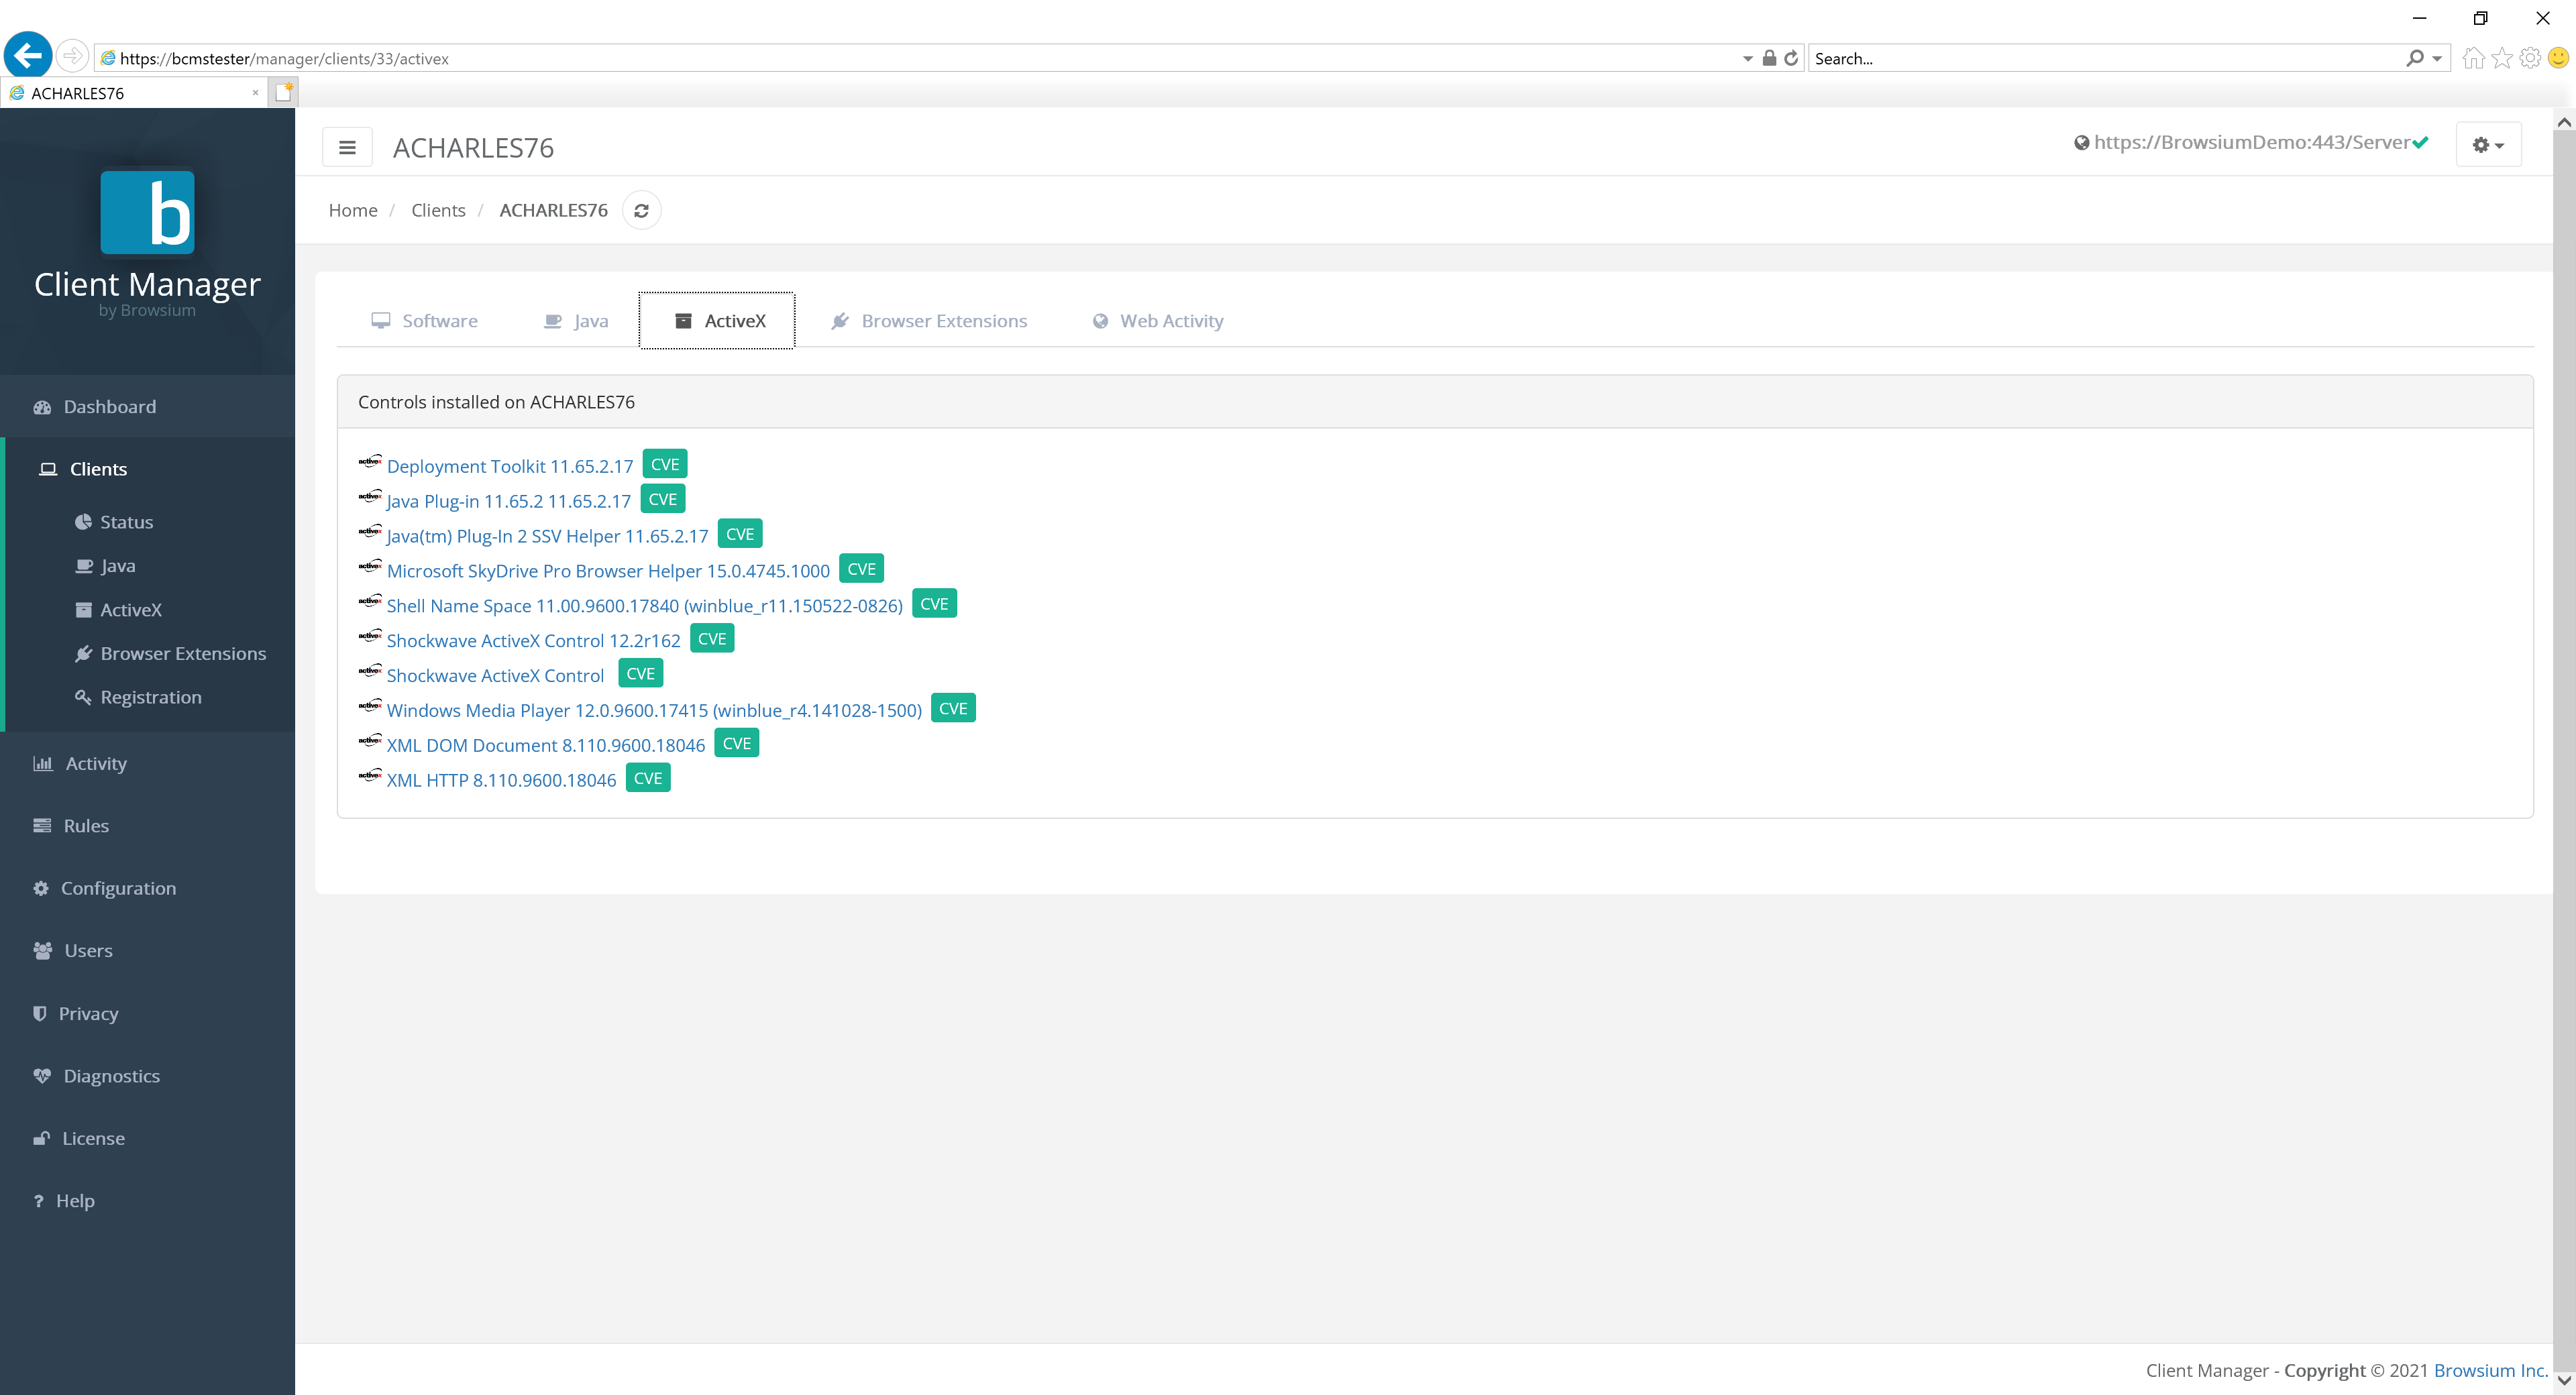 {width=“5.992687007874015in” height=“2.1197758092738406in”}
The CVE links enable quick access to the known list of published vulnerabilities for each component. Click the green CVE button to find out more on a specific control.
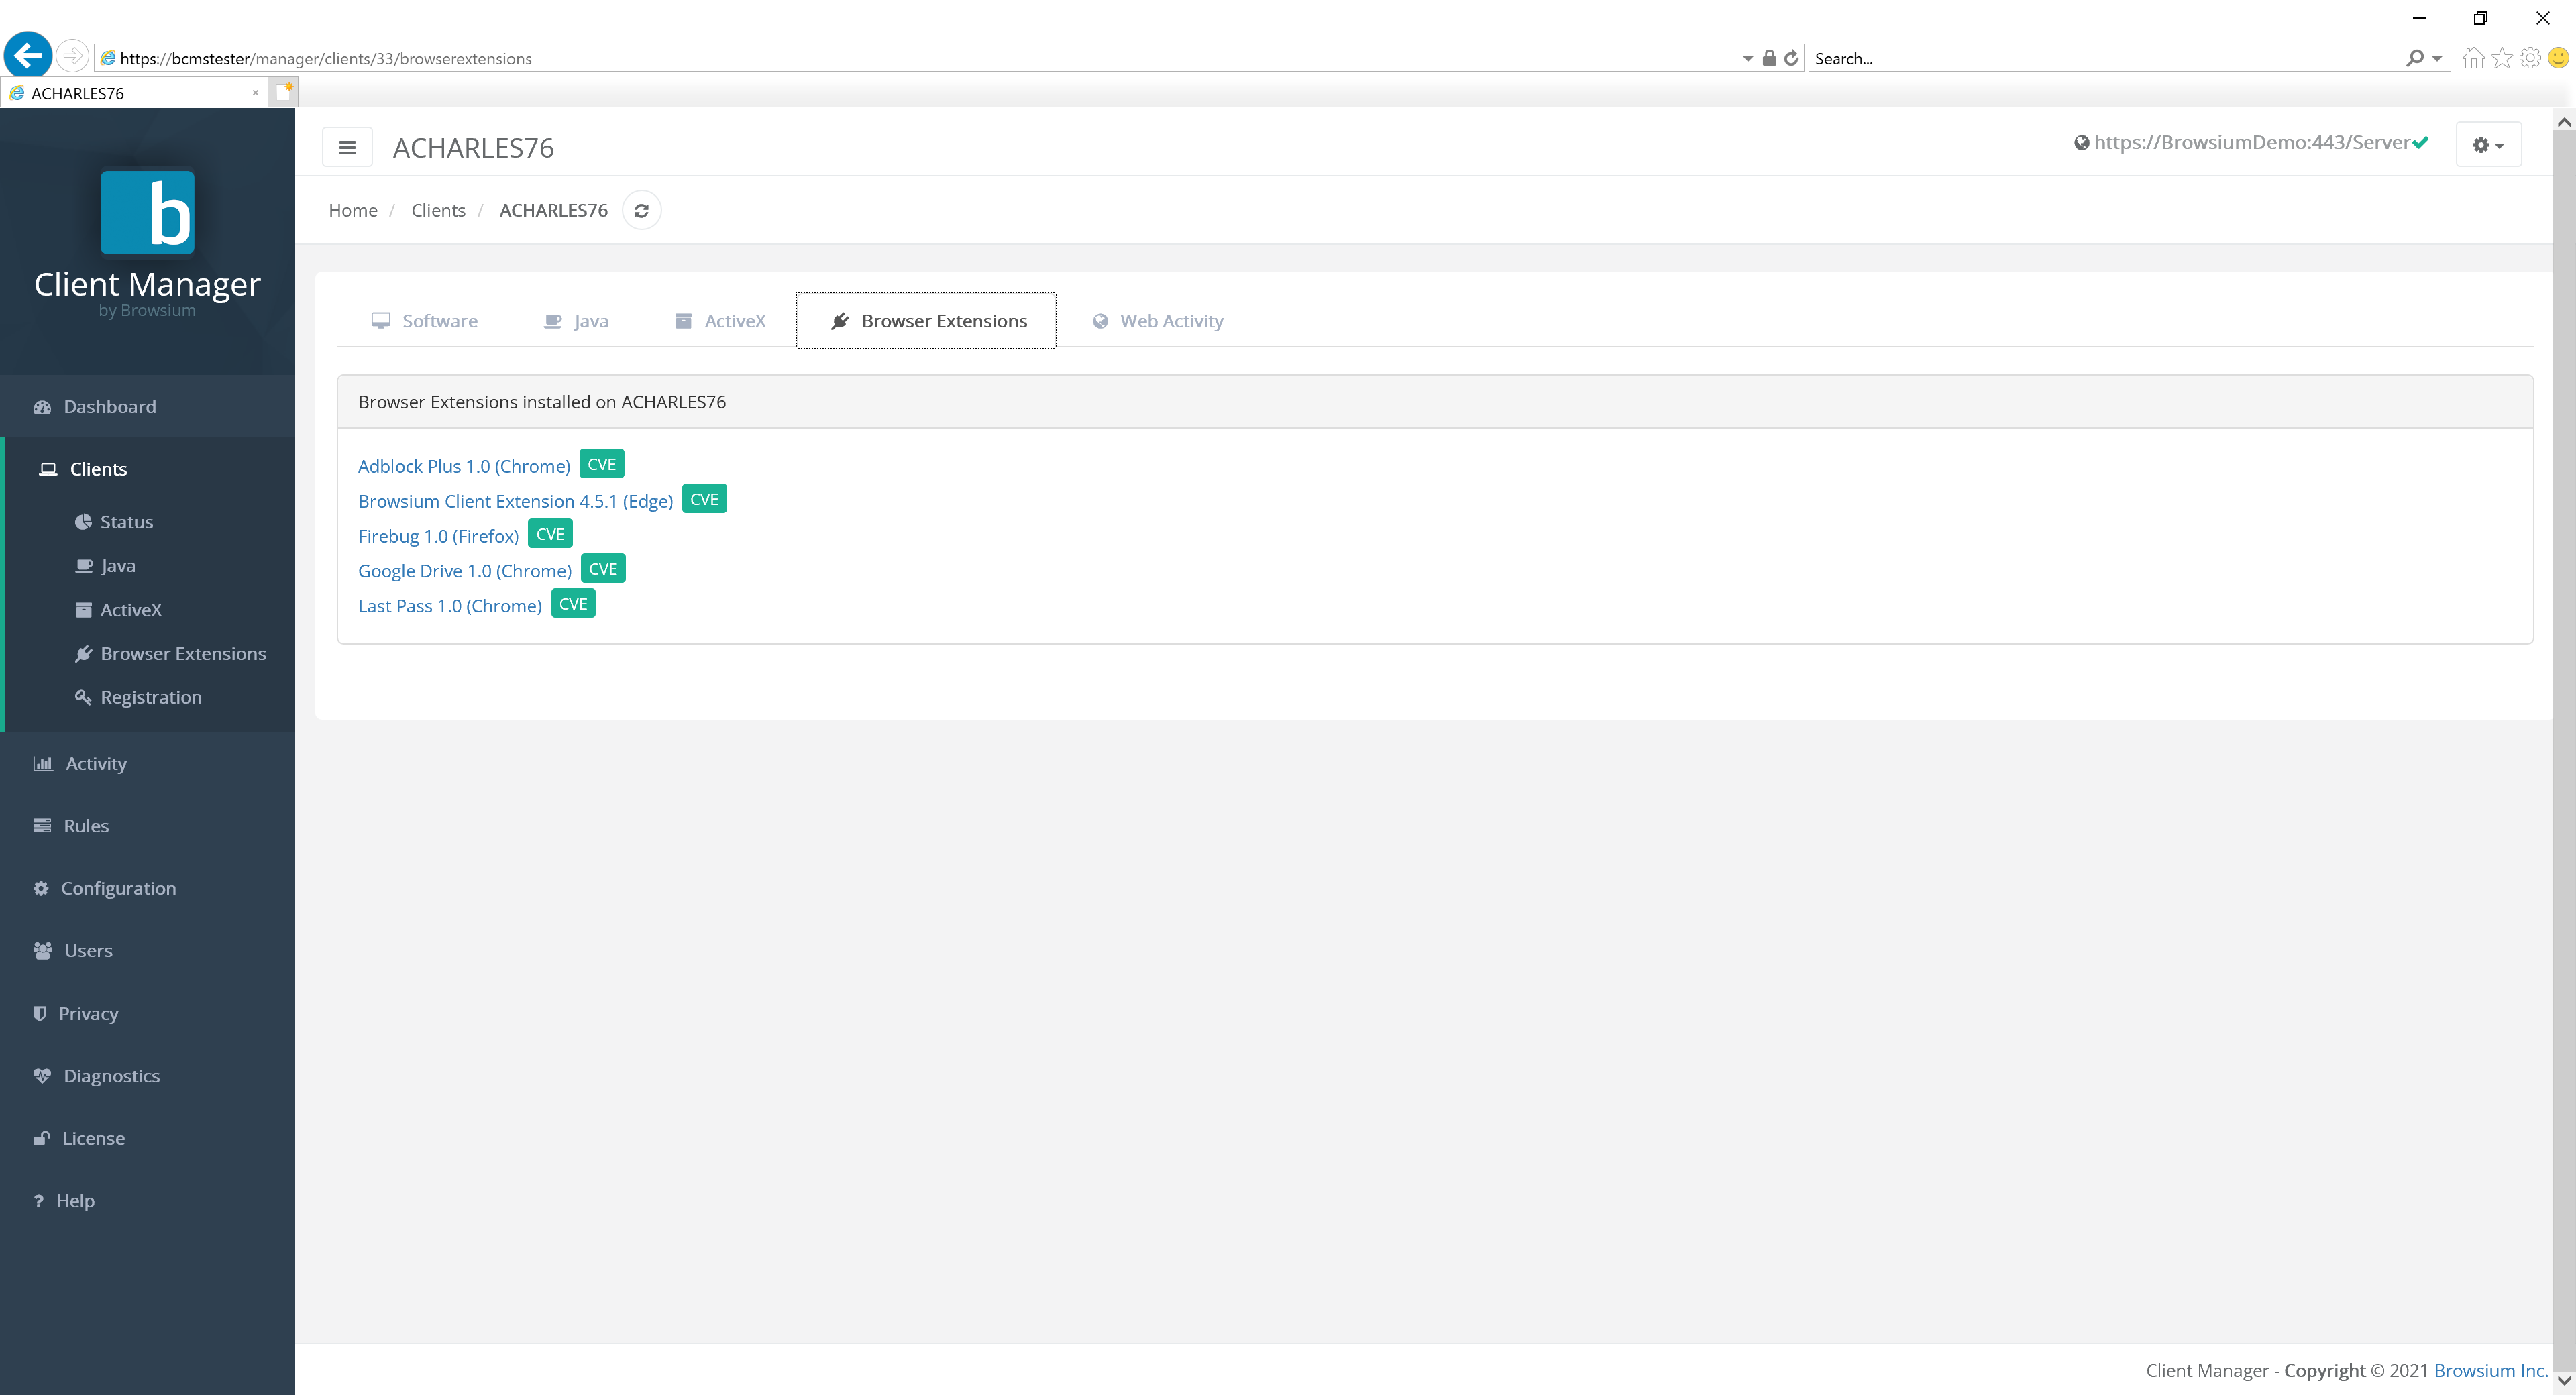
Browser Extensions offers a list of browser extensions installed for the given user.
 {width=“6.073891076115485in” height=“1.6781988188976378in”}
The CVE links enable quick access to the known list of published vulnerabilities for each component. Click the green CVE button to find out more on a specific control.
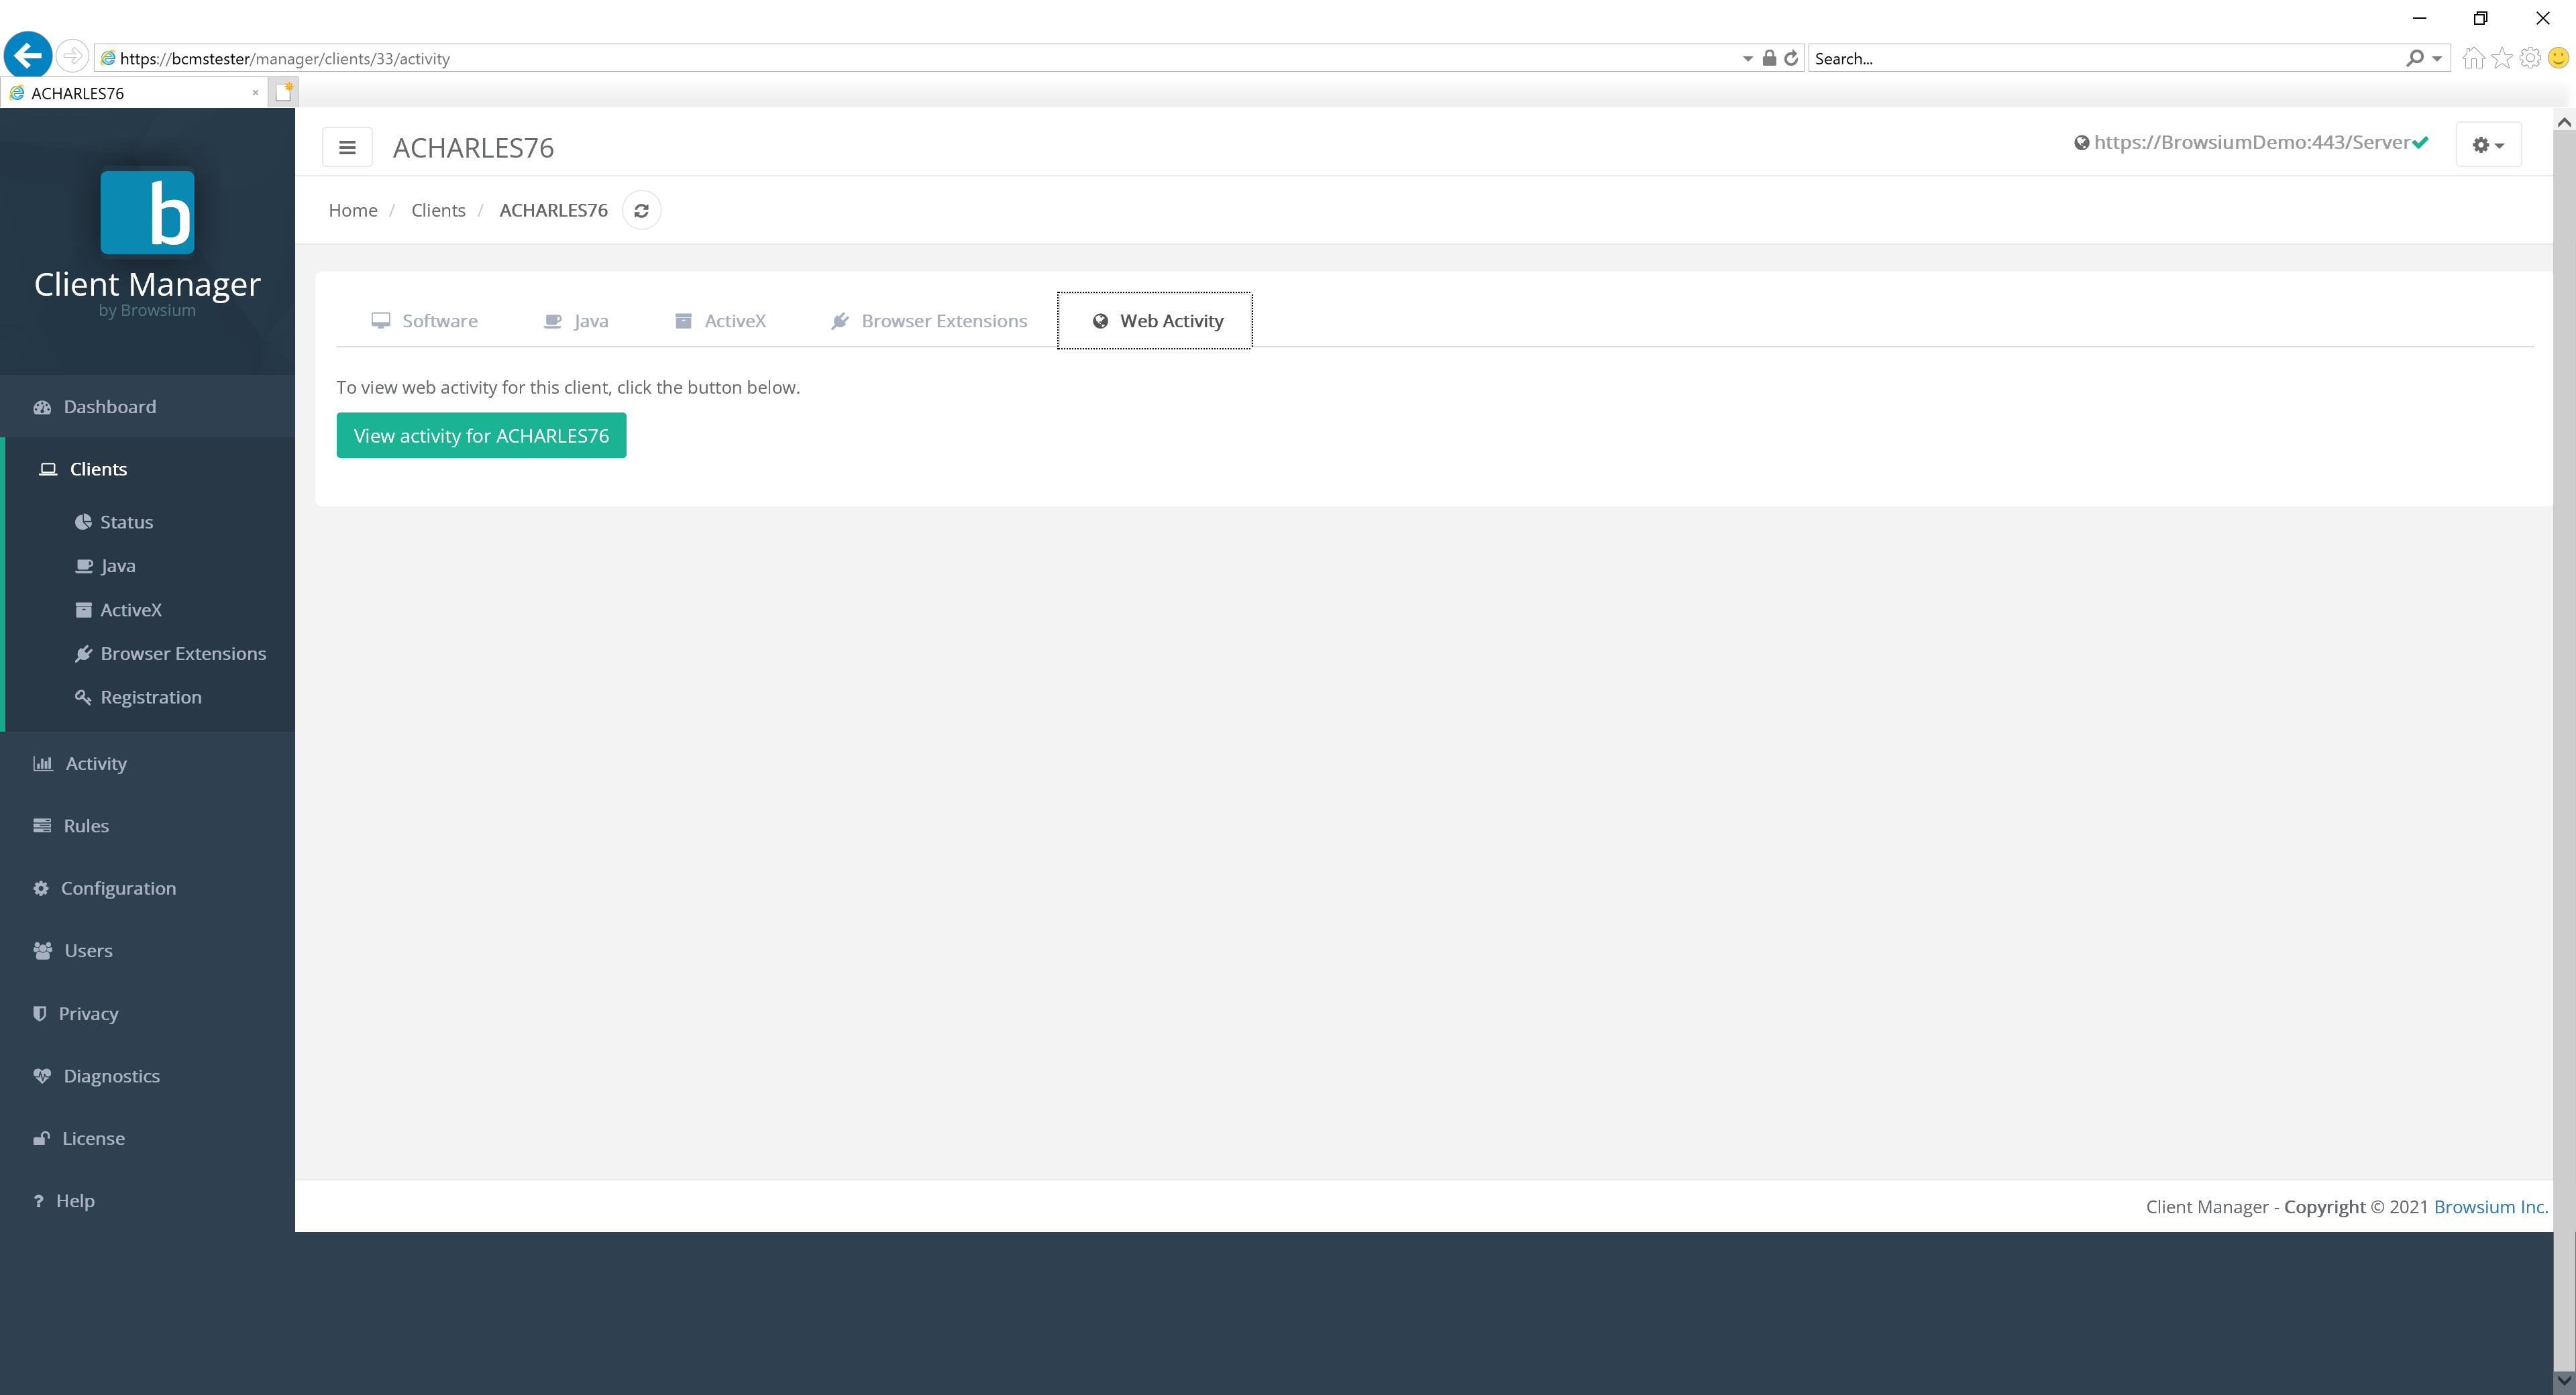
Web Activity provides easy access to a filtered view of the web applications access by this client. Click the green link button to go directly to the Web Activity detail screen.
 {width=“6.376679790026246in” height=“1.1998468941382328in”}
The Java page displays a list of all Java versions installed on Proton clients throughout your organization. Proton collects information on the version installed, as well as detailing the default version of Java used for web applications and the version used for desktop applications.
{width=“6.023934820647419in” height=“3.4426181102362206in”}
Selecting any of the listed Java versions will provide a complete list of clients in the organization with that version in stalled.
The Java Desktop Defaults tab offers a listing of Java versions and the number of desktop clients which have that one set as default.
{width=“5.978307086614174in” height=“3.0728587051618548in”}
Selecting any of the Java versions listed on this tab brings up the list of clients with that Java version set as the default.
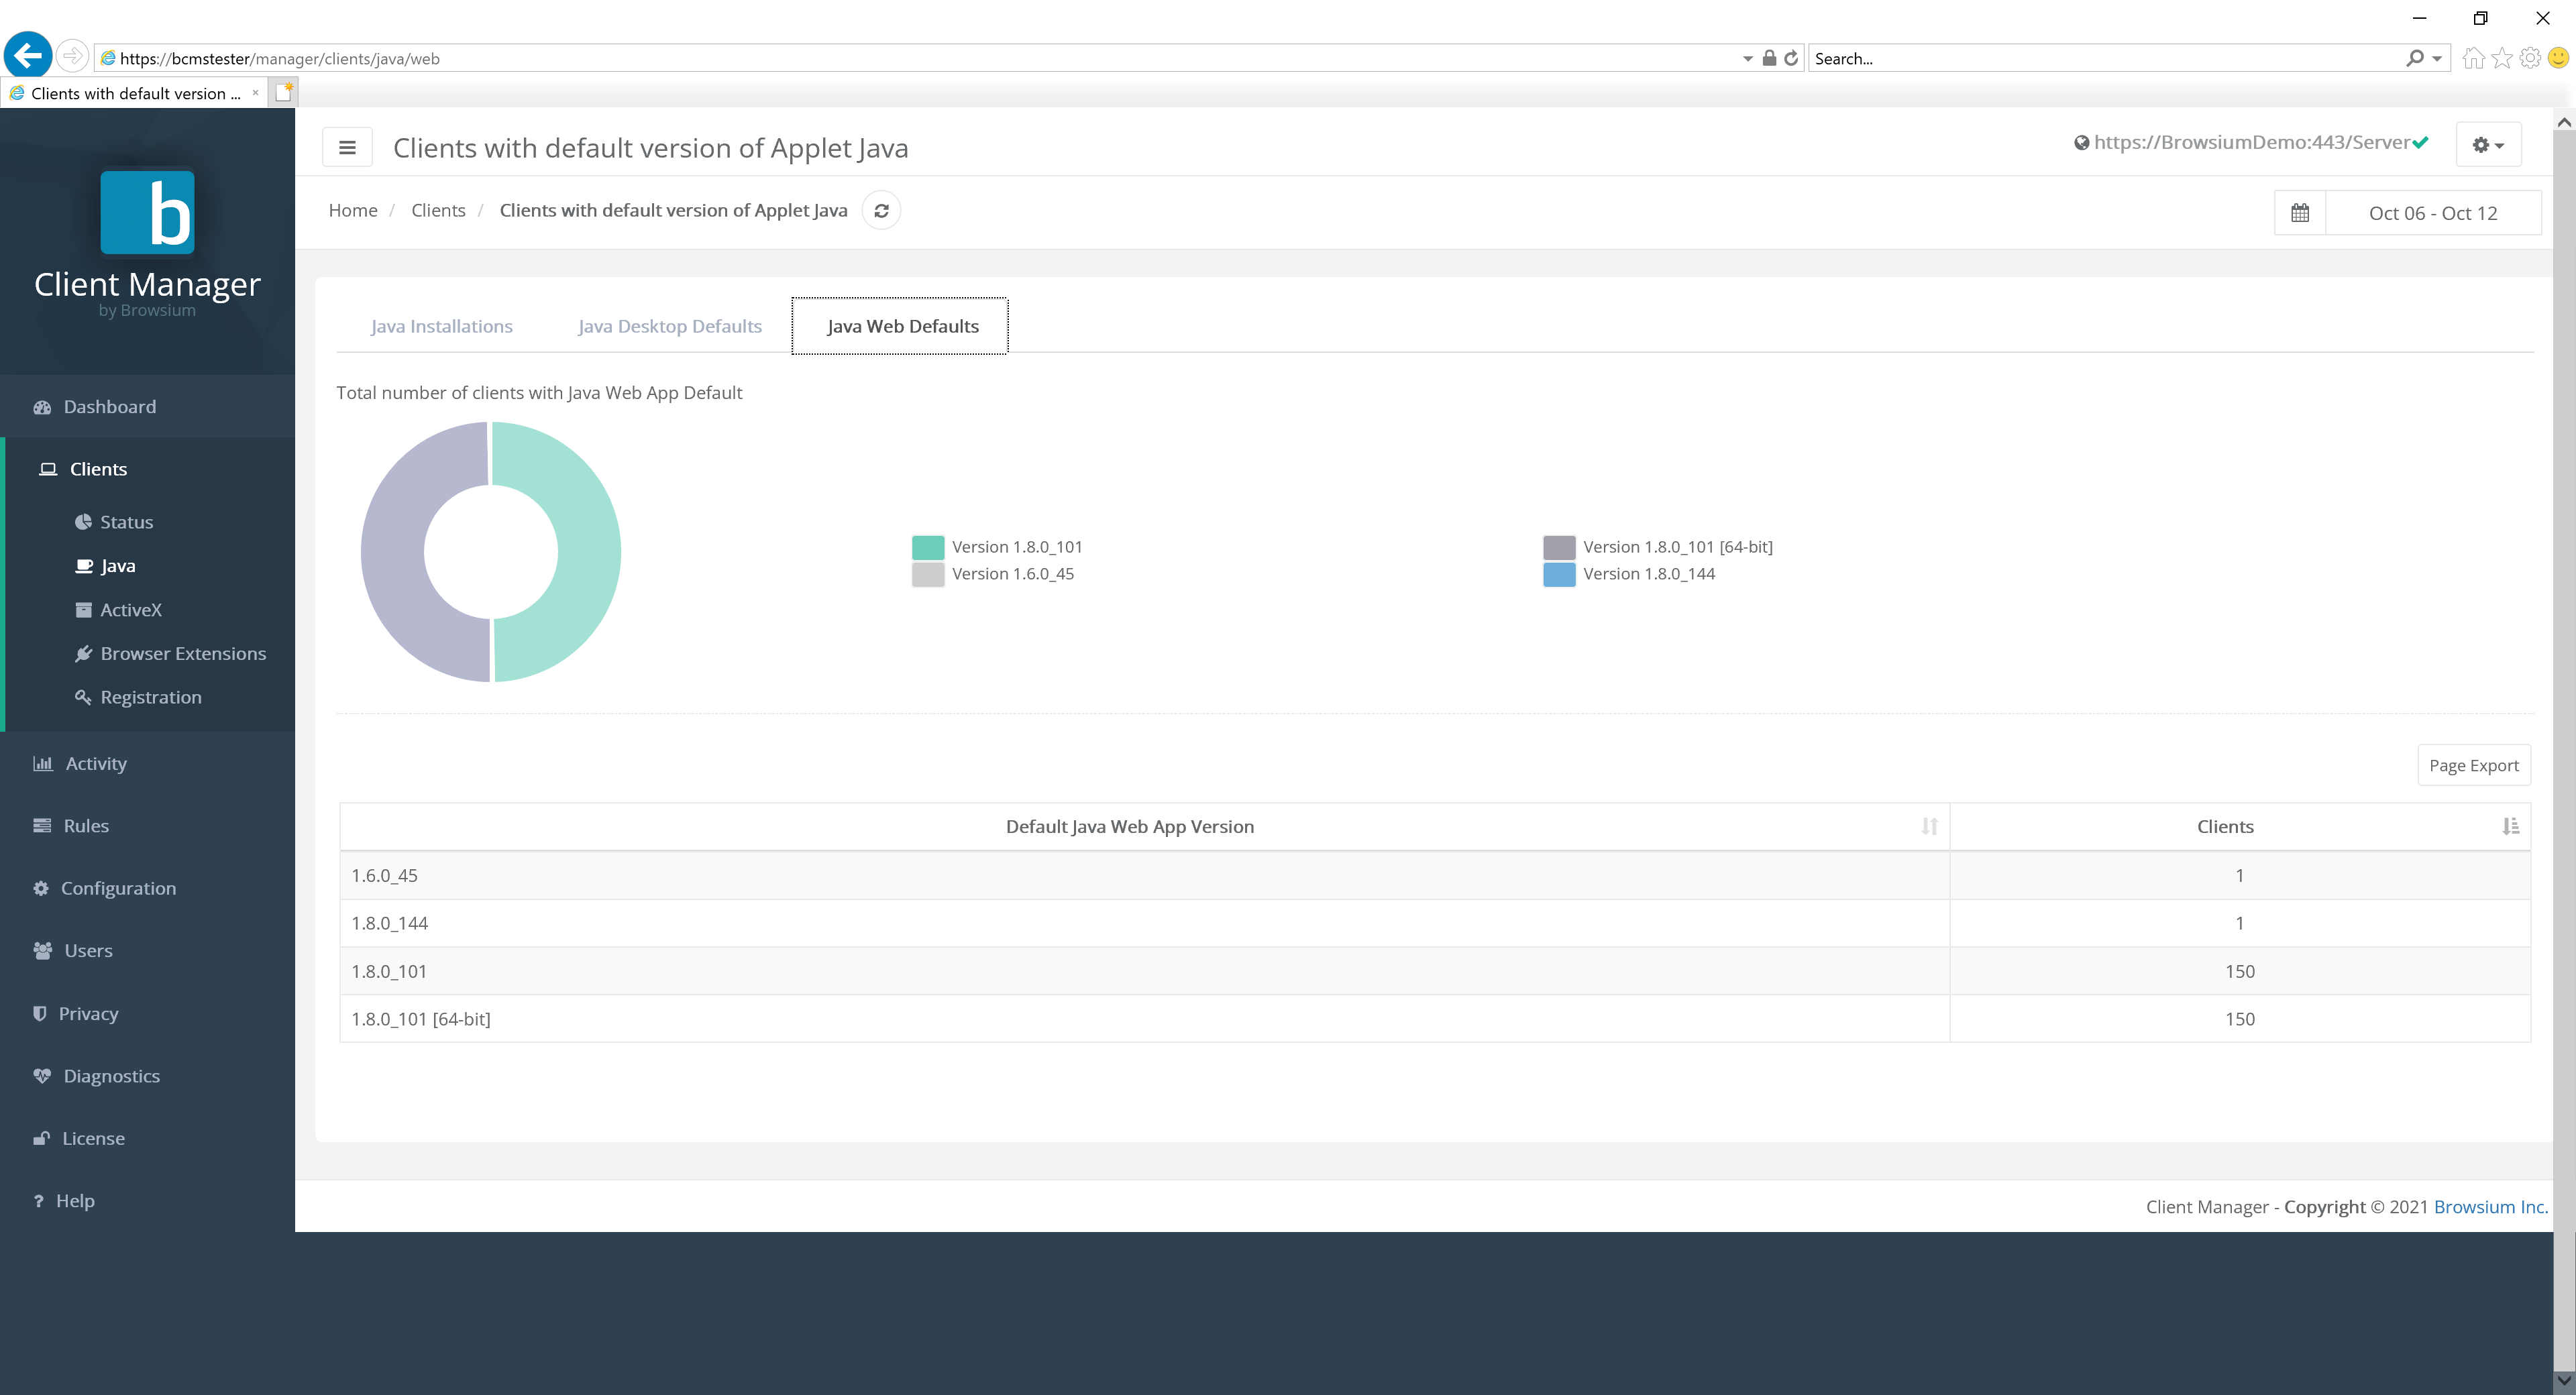
The Jave Web Defaults tab gives a listing of Java versions and the number of clients set to use that version as the default for web applications.
 {width=“5.962462817147856in” height=“2.7565430883639546in”}
Selecting any of the Java versions listed on this tab brings up the list of clients with that Java version set as the default.
ActiveX
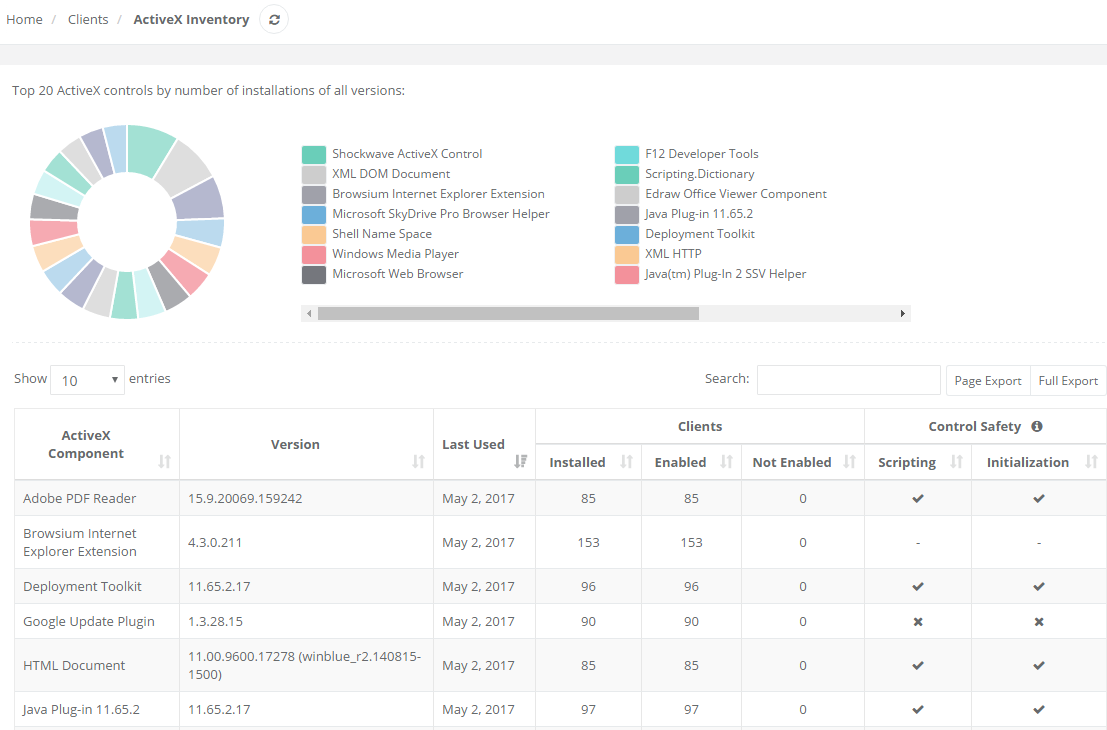
Section titled “ActiveX”The ActiveX page displays a list of all ActiveX controls installed on Proton clients across your entire organization.
 {width=“5.951938976377953in” height=“3.924718941382327in”}
The table lists all installed ActiveX controls and version information for clients throughout the enterprise as well as a list of how many clients have that particular ActiveX control installed and enabled. In addition, Proton collects and reports on ActiveX control security data, as well as related usage/activity data for each client.
Click on any ActiveX control in the table for the list of clients that have that control installed.
Extension Inventory
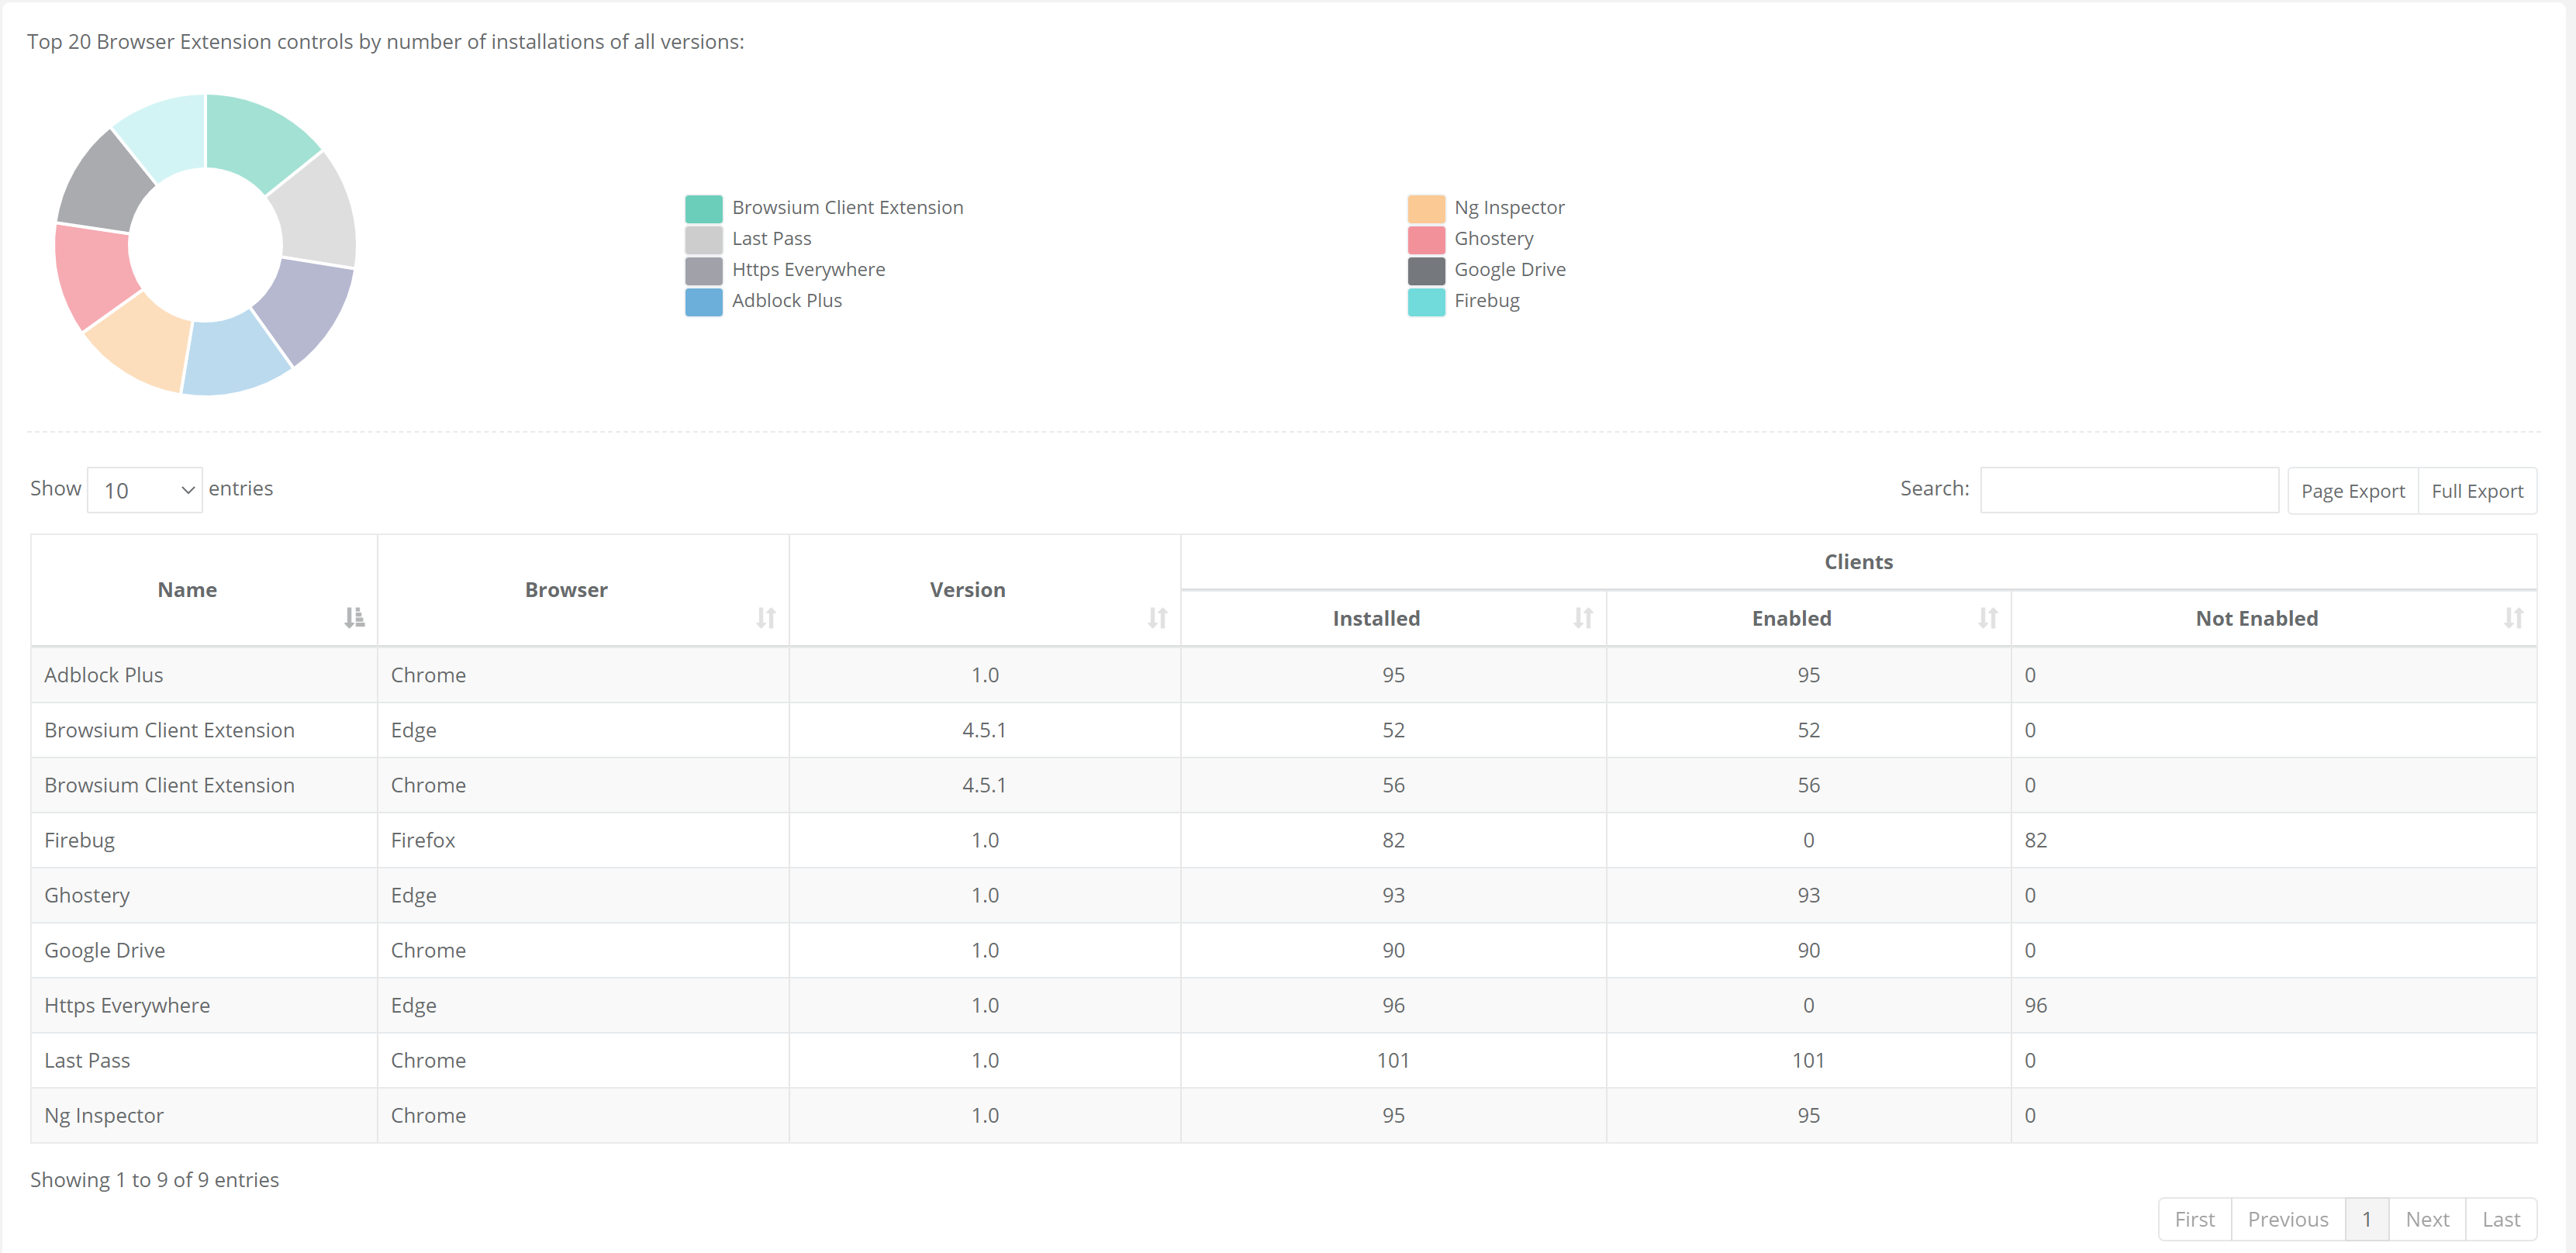
Section titled “Extension Inventory”The Extension Inventory page displays a list of all extensions installed on Proton clients across your entire organization. Extensions can be from any vendor store or side-loaded by users.
 {width=“5.508246937882765in” height=“2.679385389326334in”}
The table lists all browser extensions installed and version information, the browser with the extension installed, as well as a list of how many clients have that extension installed and enabled.
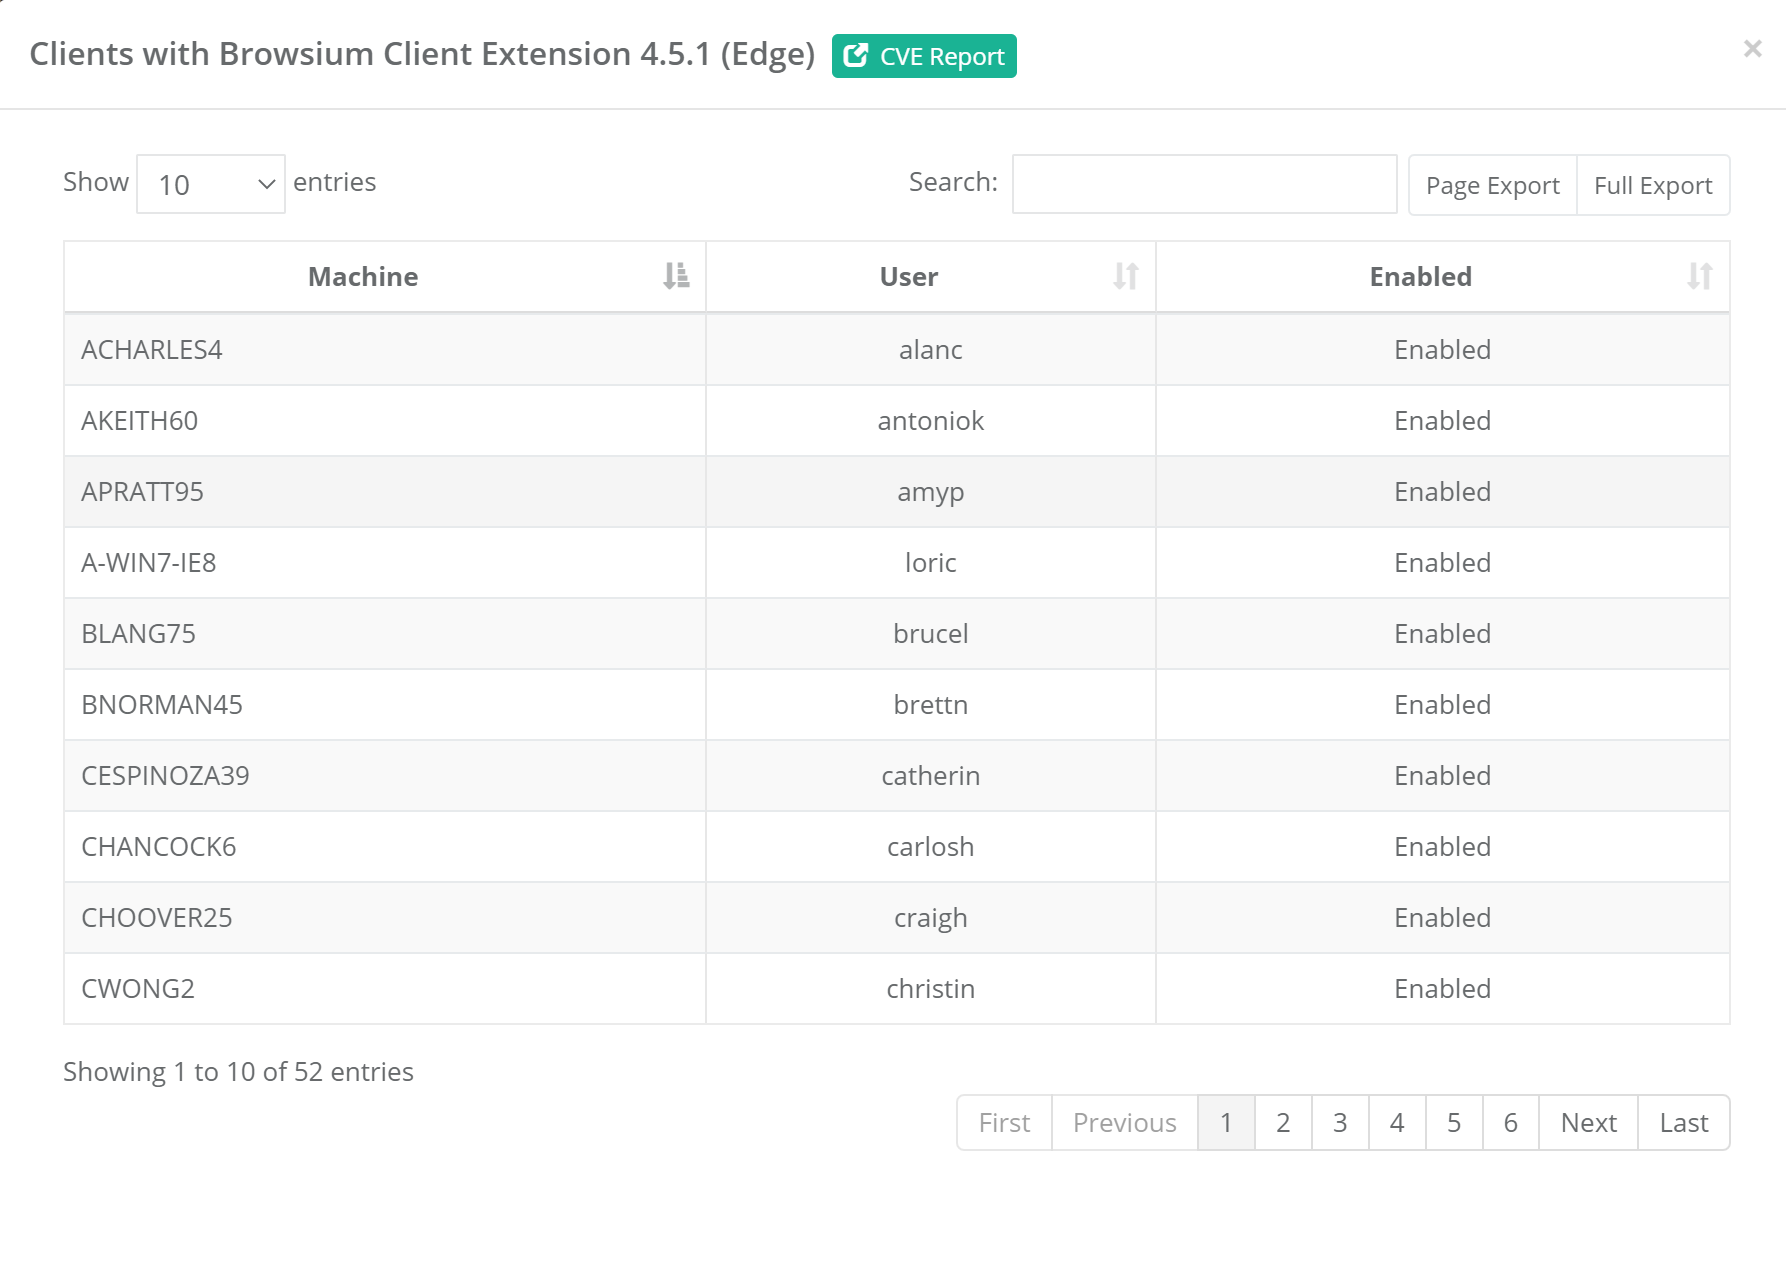
The Proton database collects and stores the extension ID, name and version from each client. Clicking on any extension in the table listing will display those clients (and users) with the extension installed:
 {width=“6.5in” height=“4.647222222222222in”}
The extension ID is not displayed in reporting but remains accessible in the database for reference if needed.
Organizations may find unfamiliar extensions installed in their environments, so the ‘CVE Report’ link provides a quick way to see any known or reported issues with a given extension.
Extension Updates
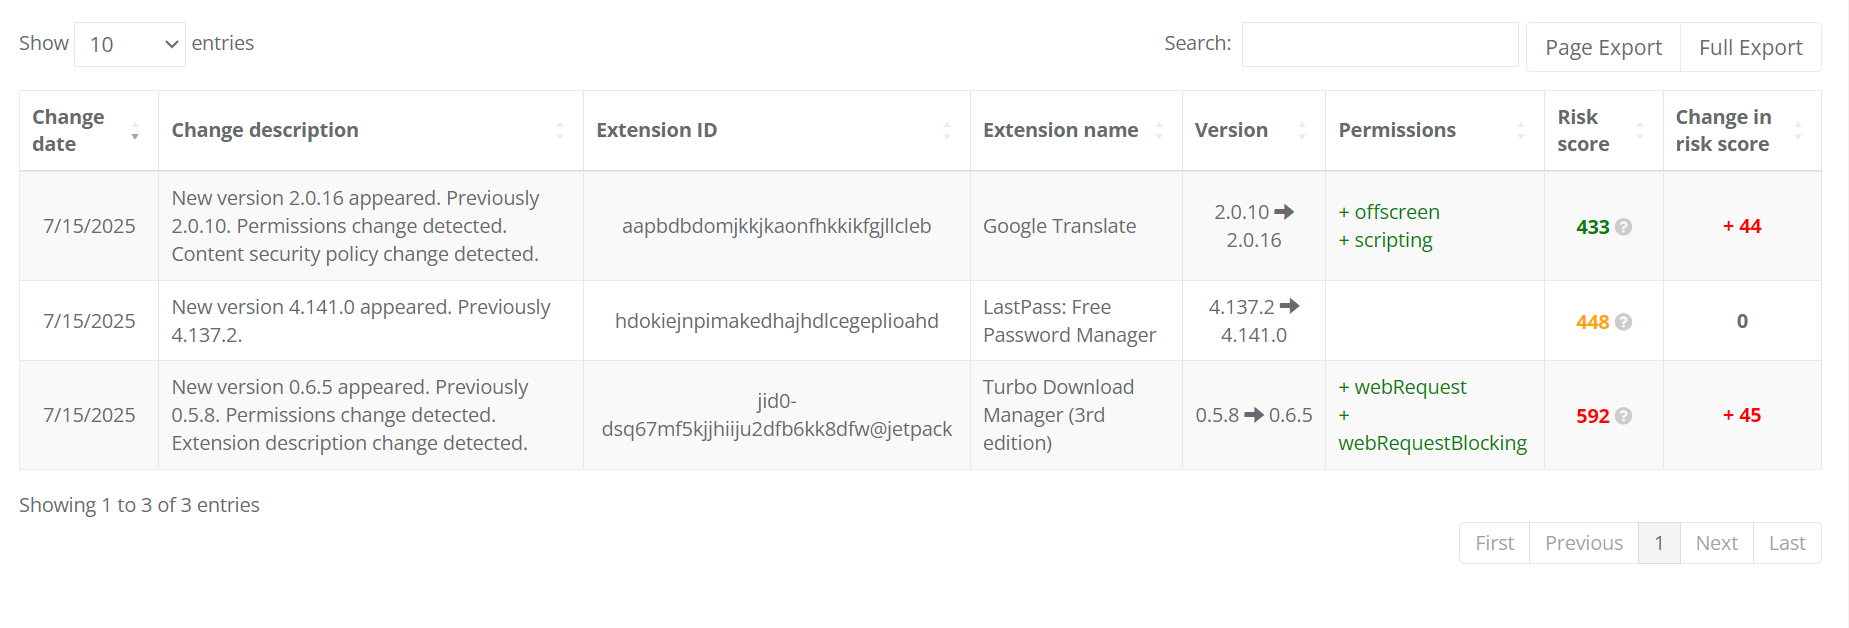
Section titled “Extension Updates”Extension Updates provides a full view of any changes to extensions from their previous version status. When an extension is updated (manually or using the auto-update mechanism) and the client data is reported to Proton, the system will perform a complete review of the new extension and manifest data. Proton will identify any changes in permissions and score the modifications based on the organization’s configuration criteria.
For more information on scoring values, see the Extension Analyzer Configuration section.
 {width=“6.5in” height=“2.207638888888889in”}Clicking on an Extension brings up the detail record view:
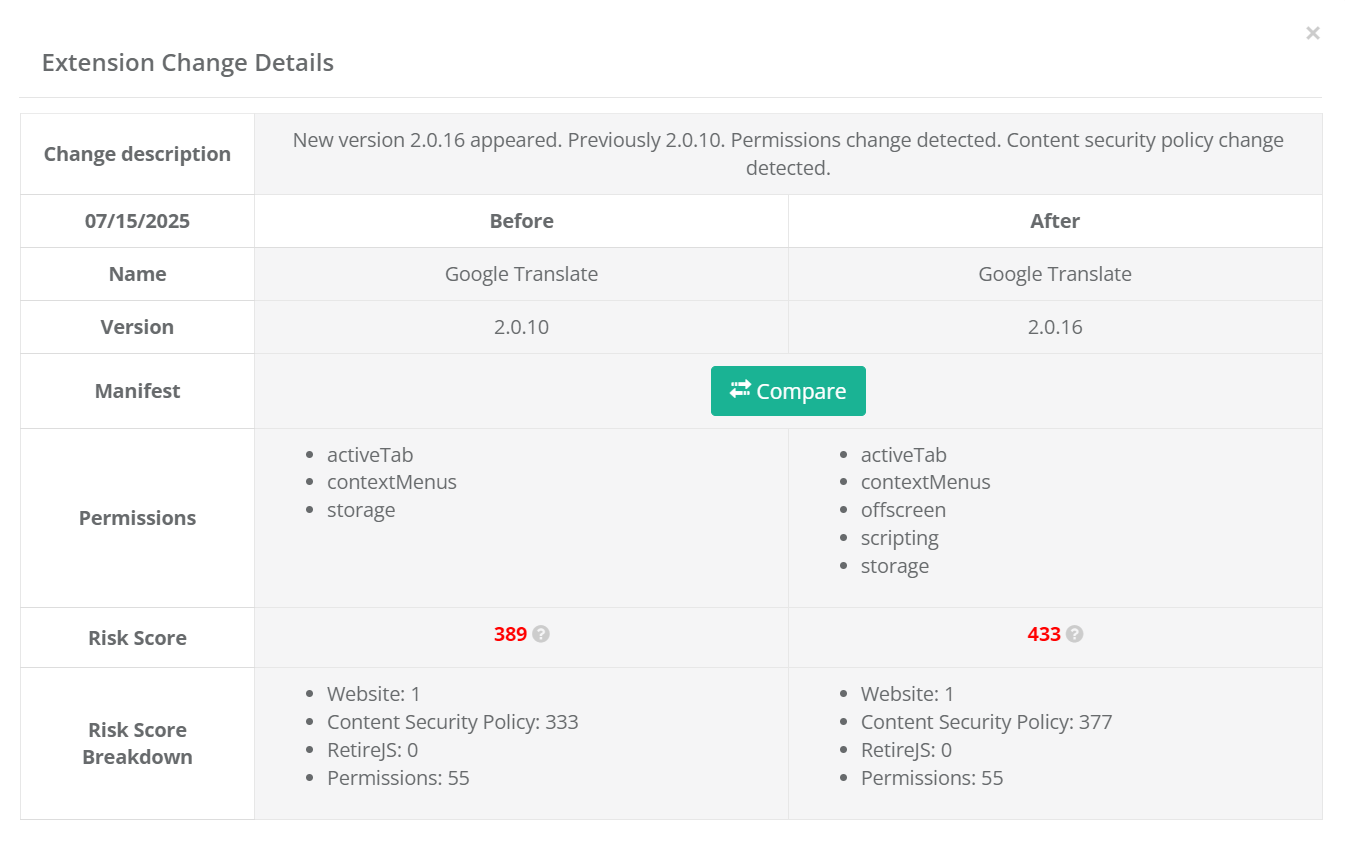 {width=“6.5in” height=“4.165972222222222in”}The Change description field offers a quick narrative style overview of the differences Proton determined between versions. This detailed view provides a side-by-side analysis of the changes between versions, providing a detailed list of changes inf Permissions Risk Score and Risk Score Breakdown.
Clicking the ‘Compare’ button brings up window with a Diff view of the two manifest documents for direct analysis.
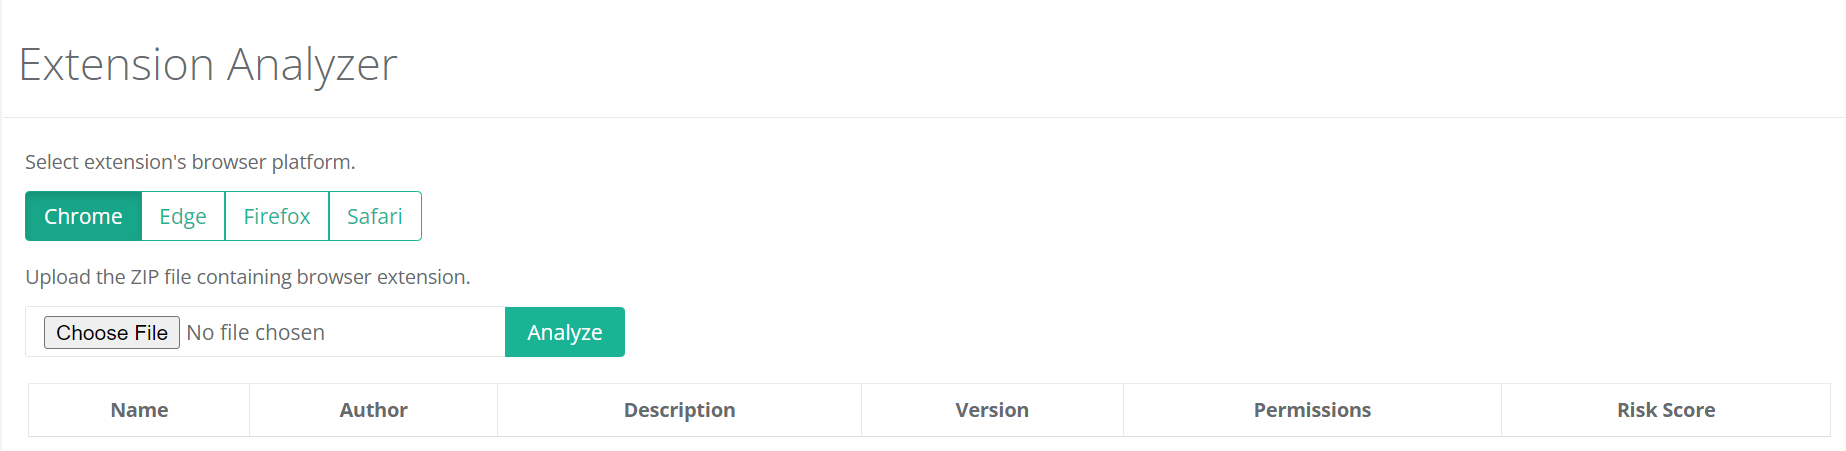
Extension Analyzer
Section titled “Extension Analyzer”To enable an organization to get detailed information on extensions prior to
Proton provides the ability to upload an extension and get an instantaneous review and Risk Analysis score.
 {width=“6.5in” height=“1.5881944444444445in”}
To upload an extension for review, simply select the browser platform and ‘Choose File’ to find the extension zip file. Once the file is selected, click ‘Analyze’. Proton will then analyze the selected extension and provide a summary view:
 {width=“6.5in” height=“0.45416666666666666in”}
The report includes information on the Extension Name, Description and Version as provided by the developer, so it is possible the name is misleading or the description field is blank. The Permissions and Risk Score data are confirmed by Proton so they will always be accurate.
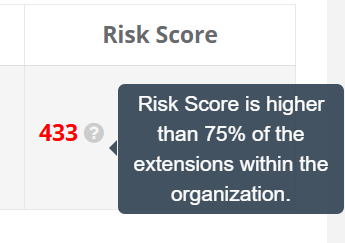
In addition to the Risk Score value calculation, Proton includes an organizational specific weight analysis for each Extension. The color coding of the Risk Score (Red/Amber/Green) will indicate if the submission is within range or an outlier compared to other extensions used in your organization.
 {width=“3.02417760279965in” height=“2.1300732720909887in”}
Registration
Section titled “Registration”This section is for Browsium Client Management Server (BCMS) usage and not directly related to Proton. Please see the Browsium Client Management Server Administration Guide for more information on these items.
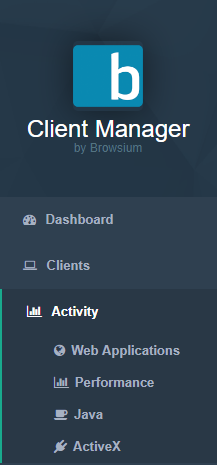
Activity Section
Section titled “Activity Section”The Activity section of the navigation bar provides access to detailed activity data for your organization’s web applications. The four sub-pages provide usage reports for Web Applications, Performance, Java, and ActiveX.
 {width=“1.9273654855643045in” height=“4.130069991251093in”}
These reports provide very granular data in easy-to-read tables and graphs that provide key insights on a wide range of scenarios. These include reporting which web applications are most frequently accessed by which users, which applications are performing abnormally, and which web applications utilize specific versions of Java or ActiveX controls. The following sections provide a drilldown on the reports found in each sub-page.
Web Applications
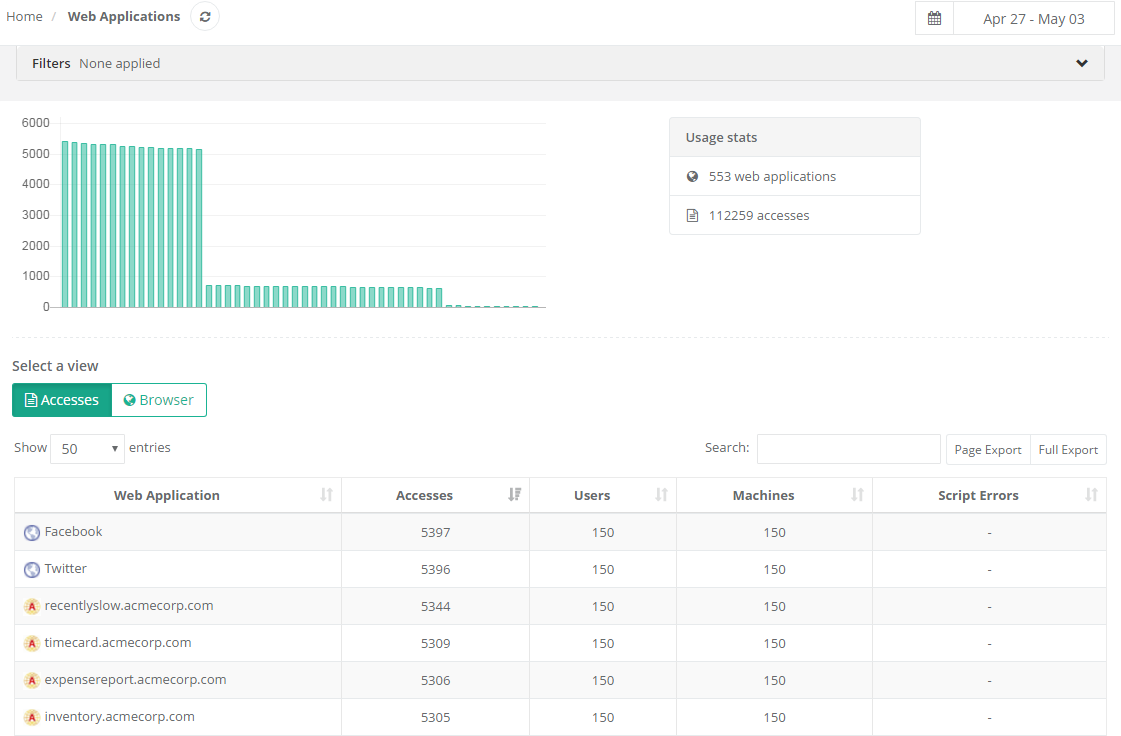
Section titled “Web Applications”The Web Applications page provides a view of accesses to each web application, sorted by the largest number of accesses by default, along with the number of users and machines from which those accesses occurred and any script errors occurring for that web application. The script errors data collection switch must be enabled on a per-web application basis, in the Summary tab of the Activity Detail view — it is off by default.
 {width=“5.749364610673666in” height=“3.7745559930008747in”}
This report is comprised of a visualization of popular applications at the top (in graph form), and the full list of applications visited at the bottom (in table form) in the Accesses section.
A filter at the top of each Activity page allows you to easily limit the results displayed by zone, browser, machine name or domain user, Client IP, AD Site, or User OU values:
{width=“6.0292475940507435in” height=“0.5559022309711286in”}
Usage Graph
Section titled “Usage Graph”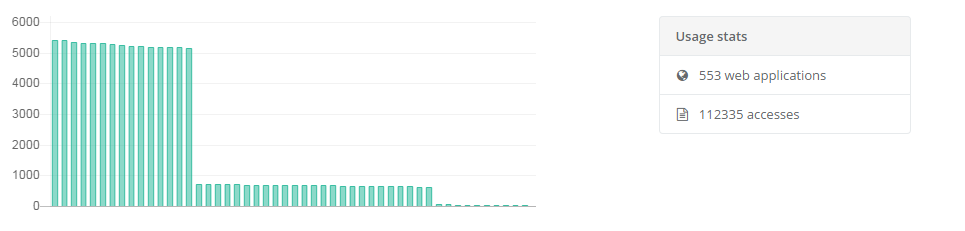 {width=“5.937708880139983in” height=“1.4216240157480315in”}
Hover the mouse pointer over any element in the graph to see more information:
{width=“2.358591426071741in” height=“1.916907261592301in”}
This will display both the application / site name as well as the number of times that particular application was accessed in the date range currently being viewed.
Accesses View
Section titled “Accesses View”The table lists results based on filters applied and date range chosen in the date picker control:
-
Name of unique web applications visited
-
Number of times in total that web application has been visited
-
Number of unique users who have visited that web application
-
Number of unique machines that have visited that web application (as machines can have more than one user)
-
Script errors that have been logged by users access that web application
{width=“5.9223851706036745in” height=“1.6527001312335958in”}
Users can find information in the list by typing relevant web application names or sub-strings in the search box.
The search box is limited to searching the web application name field. Filters can be used to filter the view by browser, zone, and many other parameters.
Click on any row in the table for detailed information about that web application. Additional details on page level activity can be accessed by clicking any row of the Activity Detail page to access the Web Application Details for a given web application.
Page level Activity Detail reporting includes additional information about Document Mode, X-UA-Compatibility/META Tags, and User Agent values.
Browser View
Section titled “Browser View”Selecting the ‘Browsers’ view of the table will instead show which browsers, document modes, Ion profiles, and Internet Explorer Zones have been used to access the web applications.
{width=“5.95811789151356in” height=“1.9870067804024496in”}
Activity Detail View
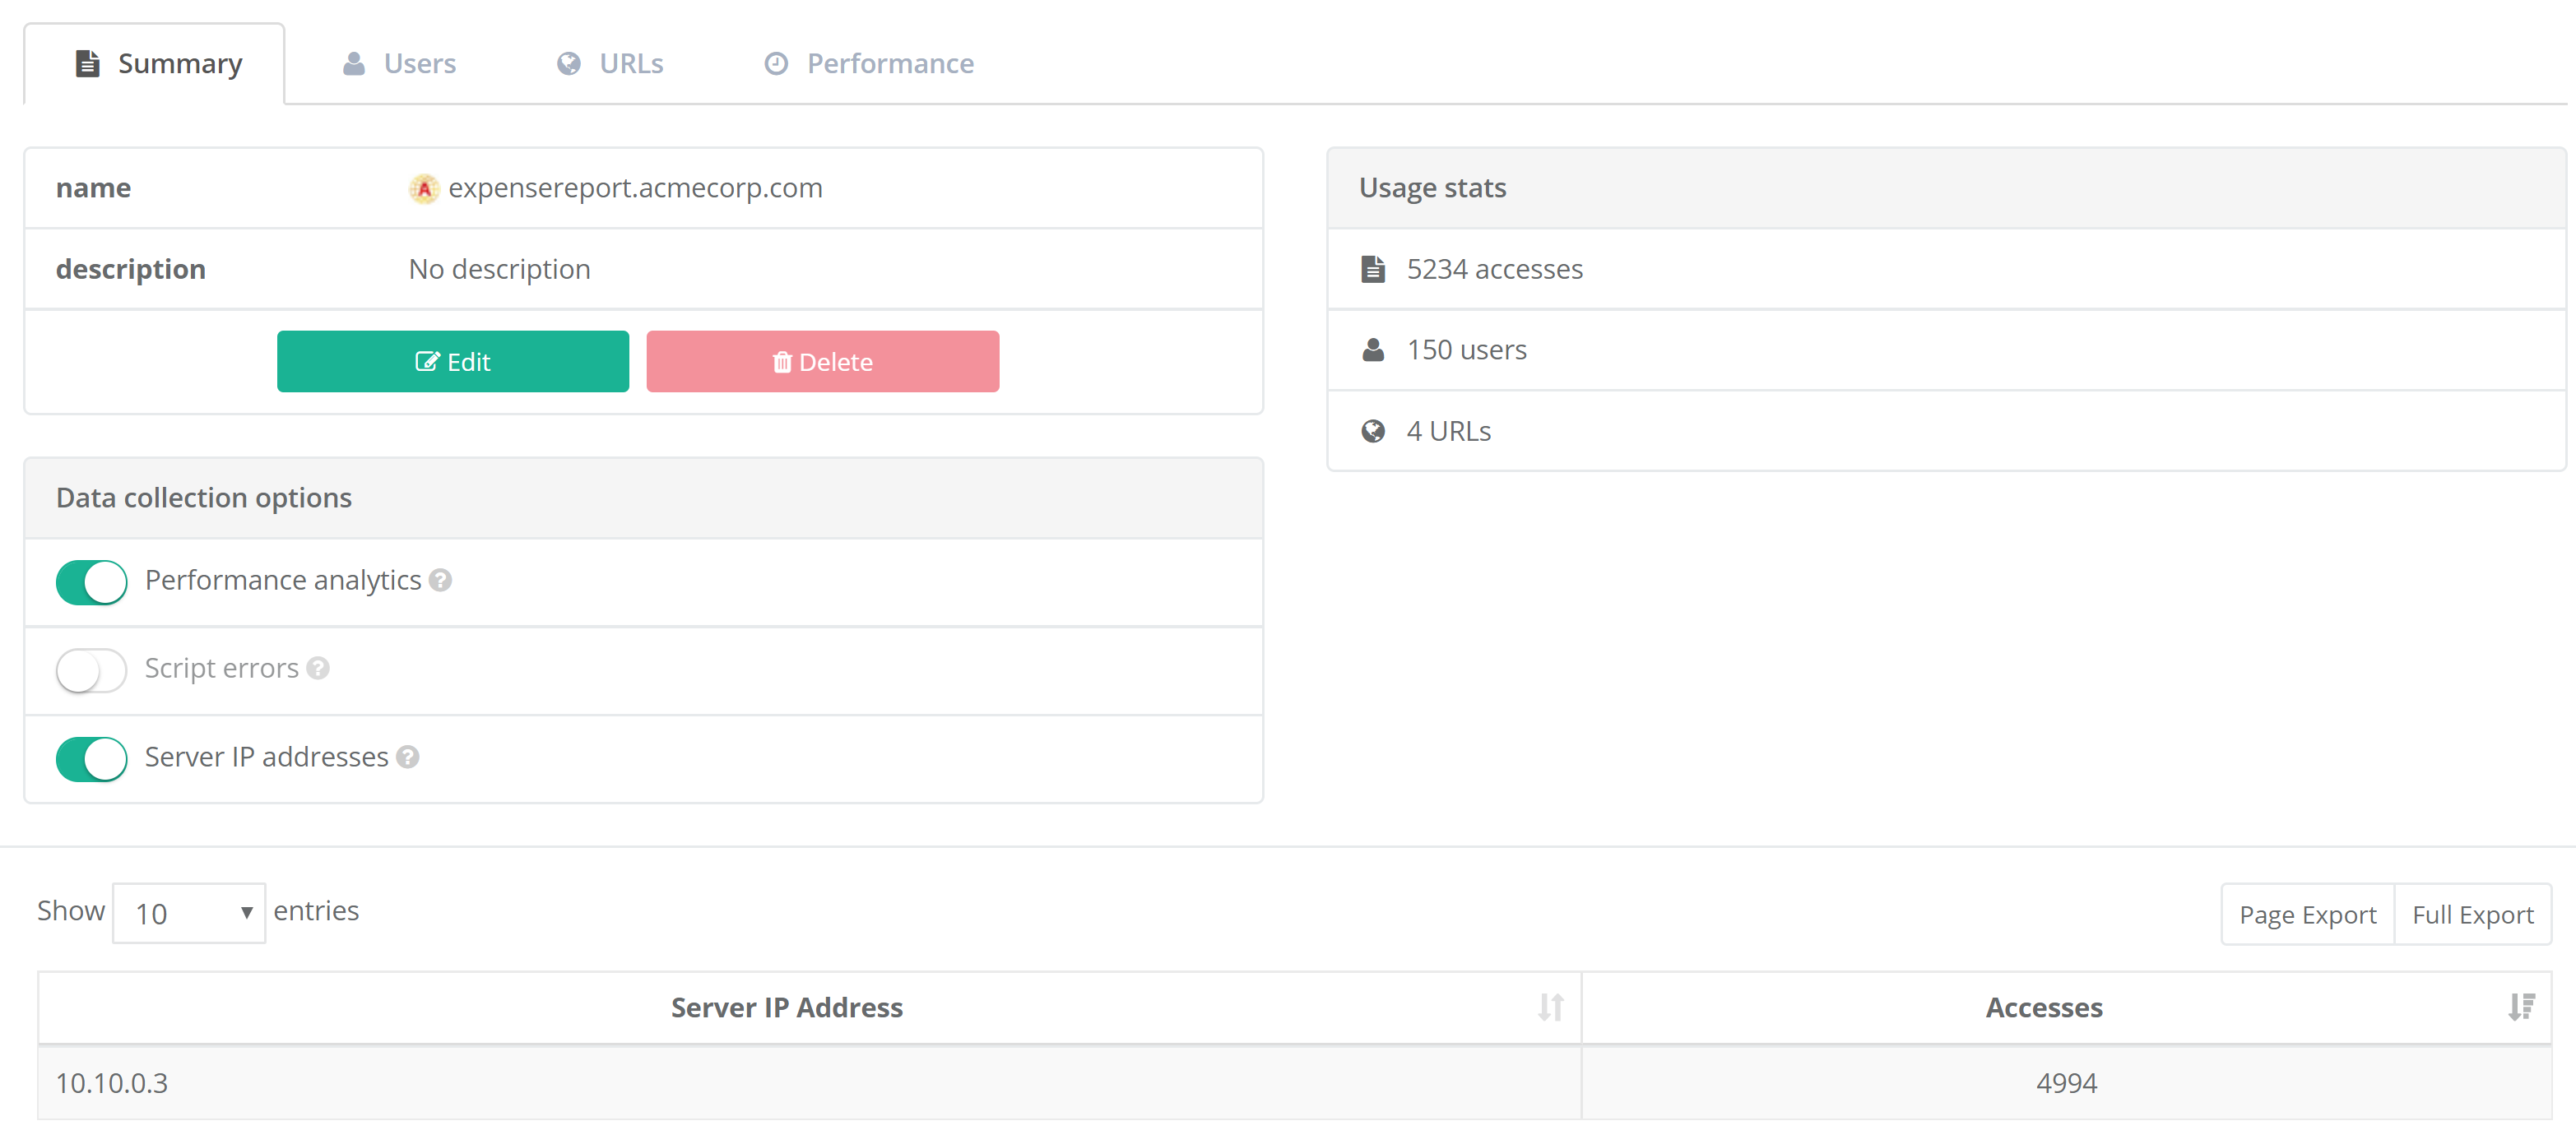
Section titled “Activity Detail View”Proton includes a granular display of the details for every web application. Select any web application from the Access or Browsers view, then click to open the Activity Detail view.
 {width=“5.832369860017498in” height=“2.5909175415573054in”}
The Summary tab of the Activity Detail view includes the name and description of the web application, along with the option to edit the fields so that they’re more relevant to your organization. You’ll also see summary usage stats, displaying the number of accesses, users, URLs, and user accounts (if user account tracking is enabled) during the date range selected in the data picker control.
Data collection options provides granular control, per web application, for enabling collection of performance analytics, script errors, and server IP addresses. Each of these settings has a master control on the Configuration page, which must be enabled before you can enable the data collection option for a given web application.
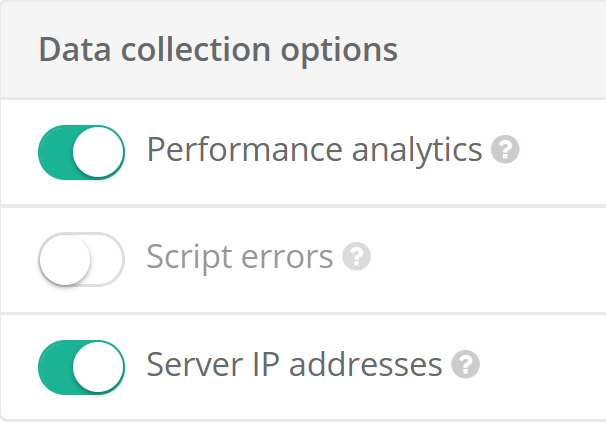 {width=“1.9119925634295714in” height=“1.350384951881015in”}
The Users tab provides details on unique user accesses, including org unit, and machine names. This information can be anonymized using Privacy Mode.
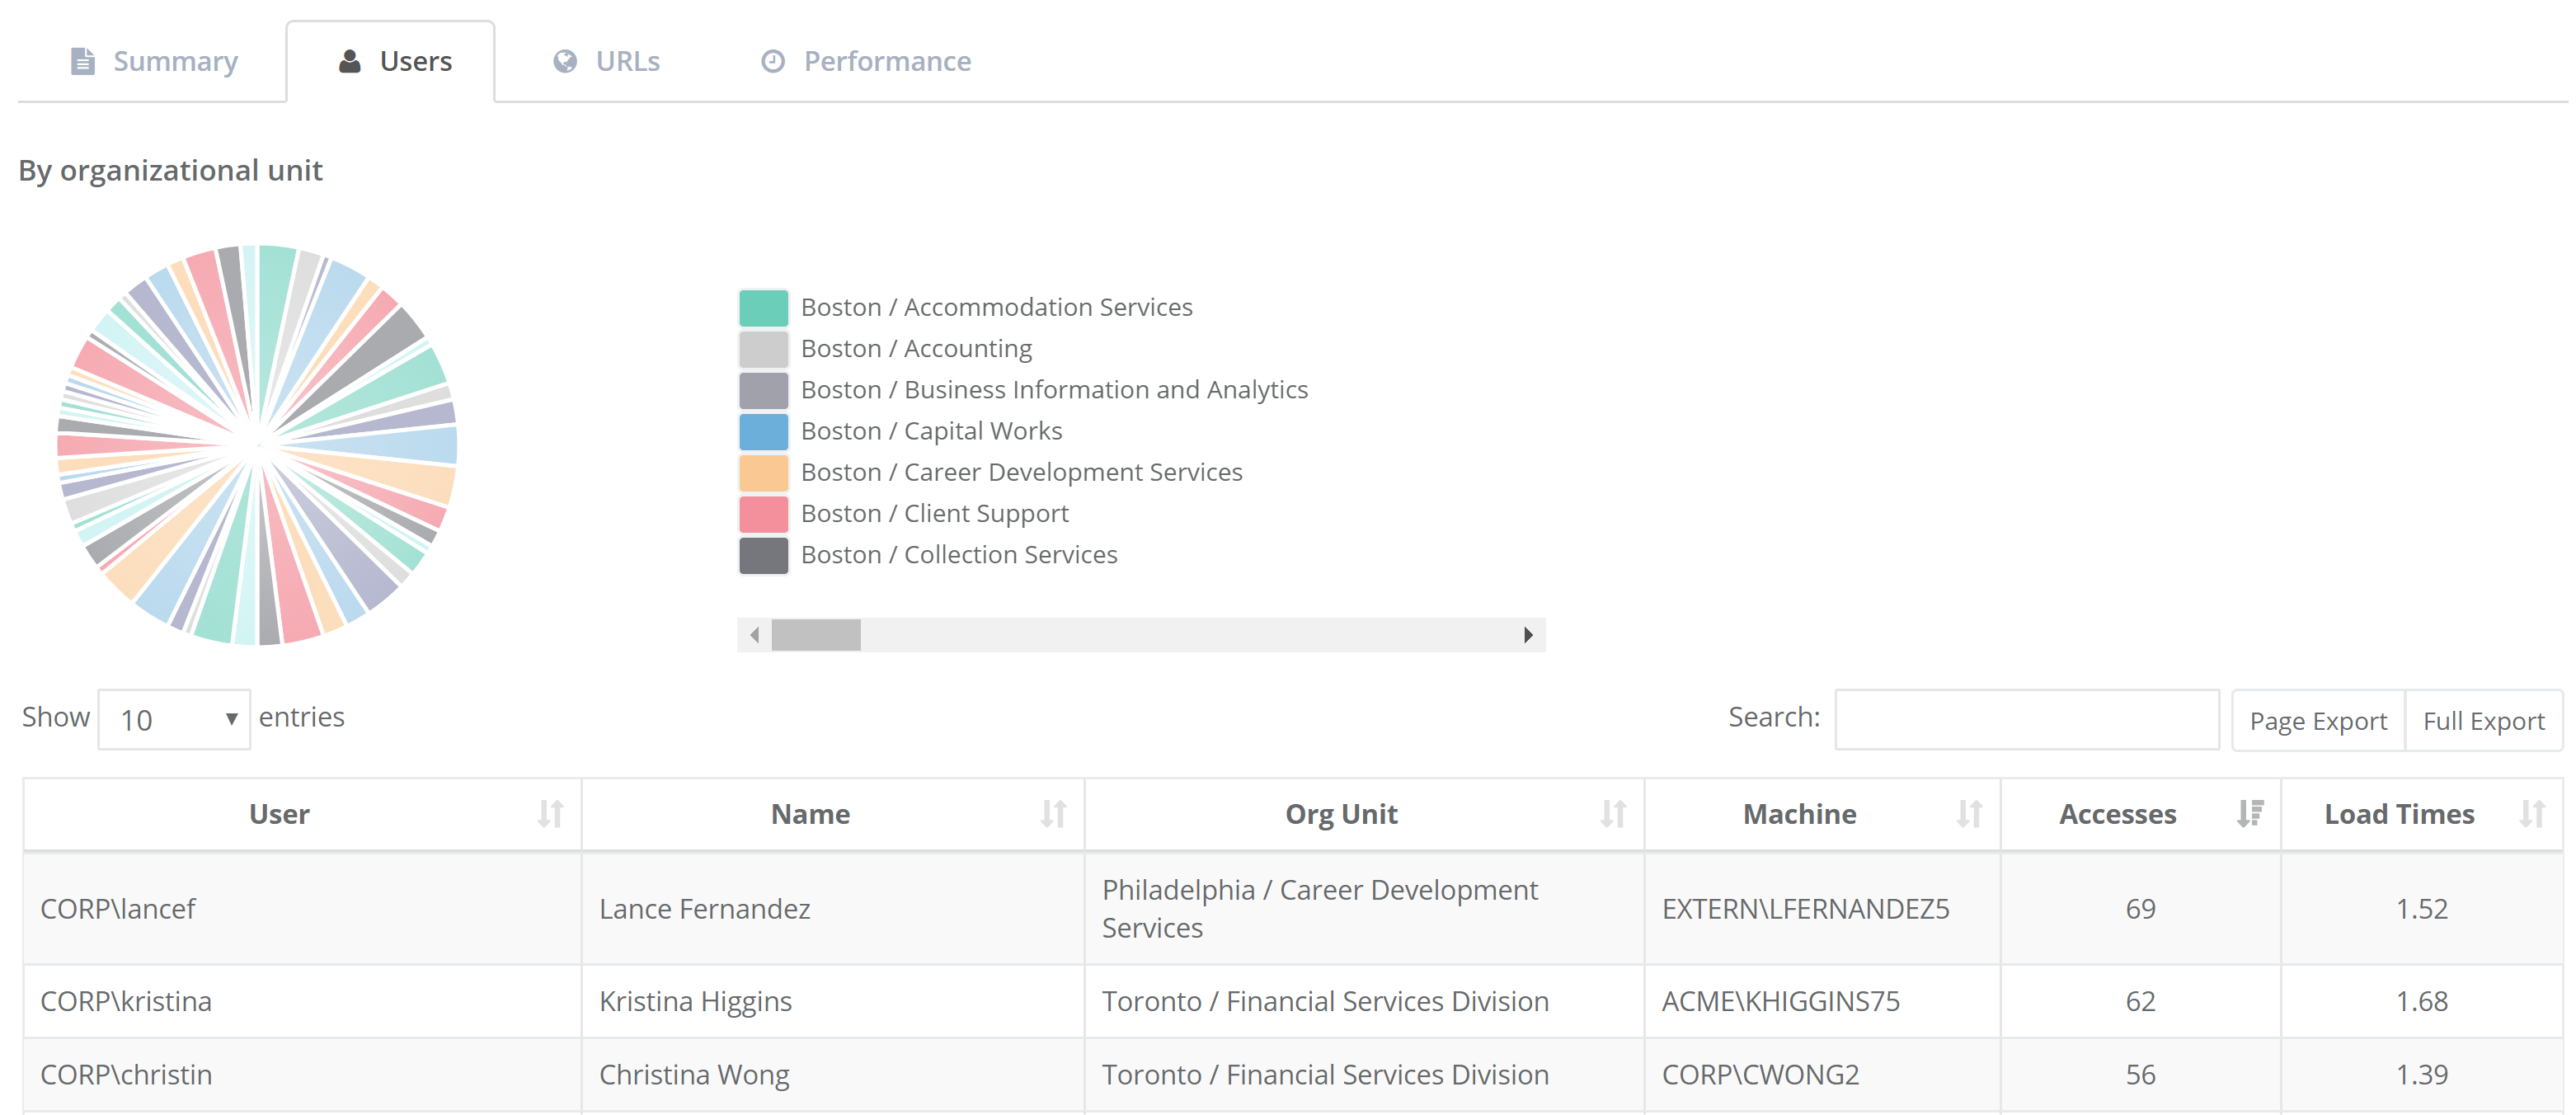 {width=“5.933417541557305in” height=“2.5679779090113737in”}
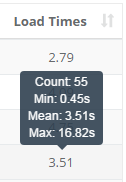
The Users tab also includes web application performance data that is collected on the client with each web application access. In this view, you can see data for web page load times for each user of the web application including the count of measurements, minimum, mean, and maximum values. Sorting by this column (descending) is an easy way to see which users are having a slower experience with this web application. You can often pick out patterns here — users with the same org unit, for example. Keep in mind that the load times shown here are aggregate across all URLs in the web application, so it might simply be that some users have different usage profiles (e.g. a tendency to access more complex pages in the web app). Drilling down from here into the actual accesses will enable you to explore that data in more detail.
 {width=“1.1810083114610674in” height=“1.705900043744532in”}
The URLs tab includes details on rule matches (see the Rules Page for more information on rules), accesses, load times, browsers used, document modes invoked, Java versions used, Ion profiles invoked, Internet Explorer zones, and script errors. This tab also includes page load times, although the view here is grouped by URL rather than user. Sorting by page load time (descending) here will show you what URLs tend to be loaded more slowly and drilling down from here will show you the actual accesses (with all the user, component, browser, and timing data) that have contributed to the load time data that is displayed.
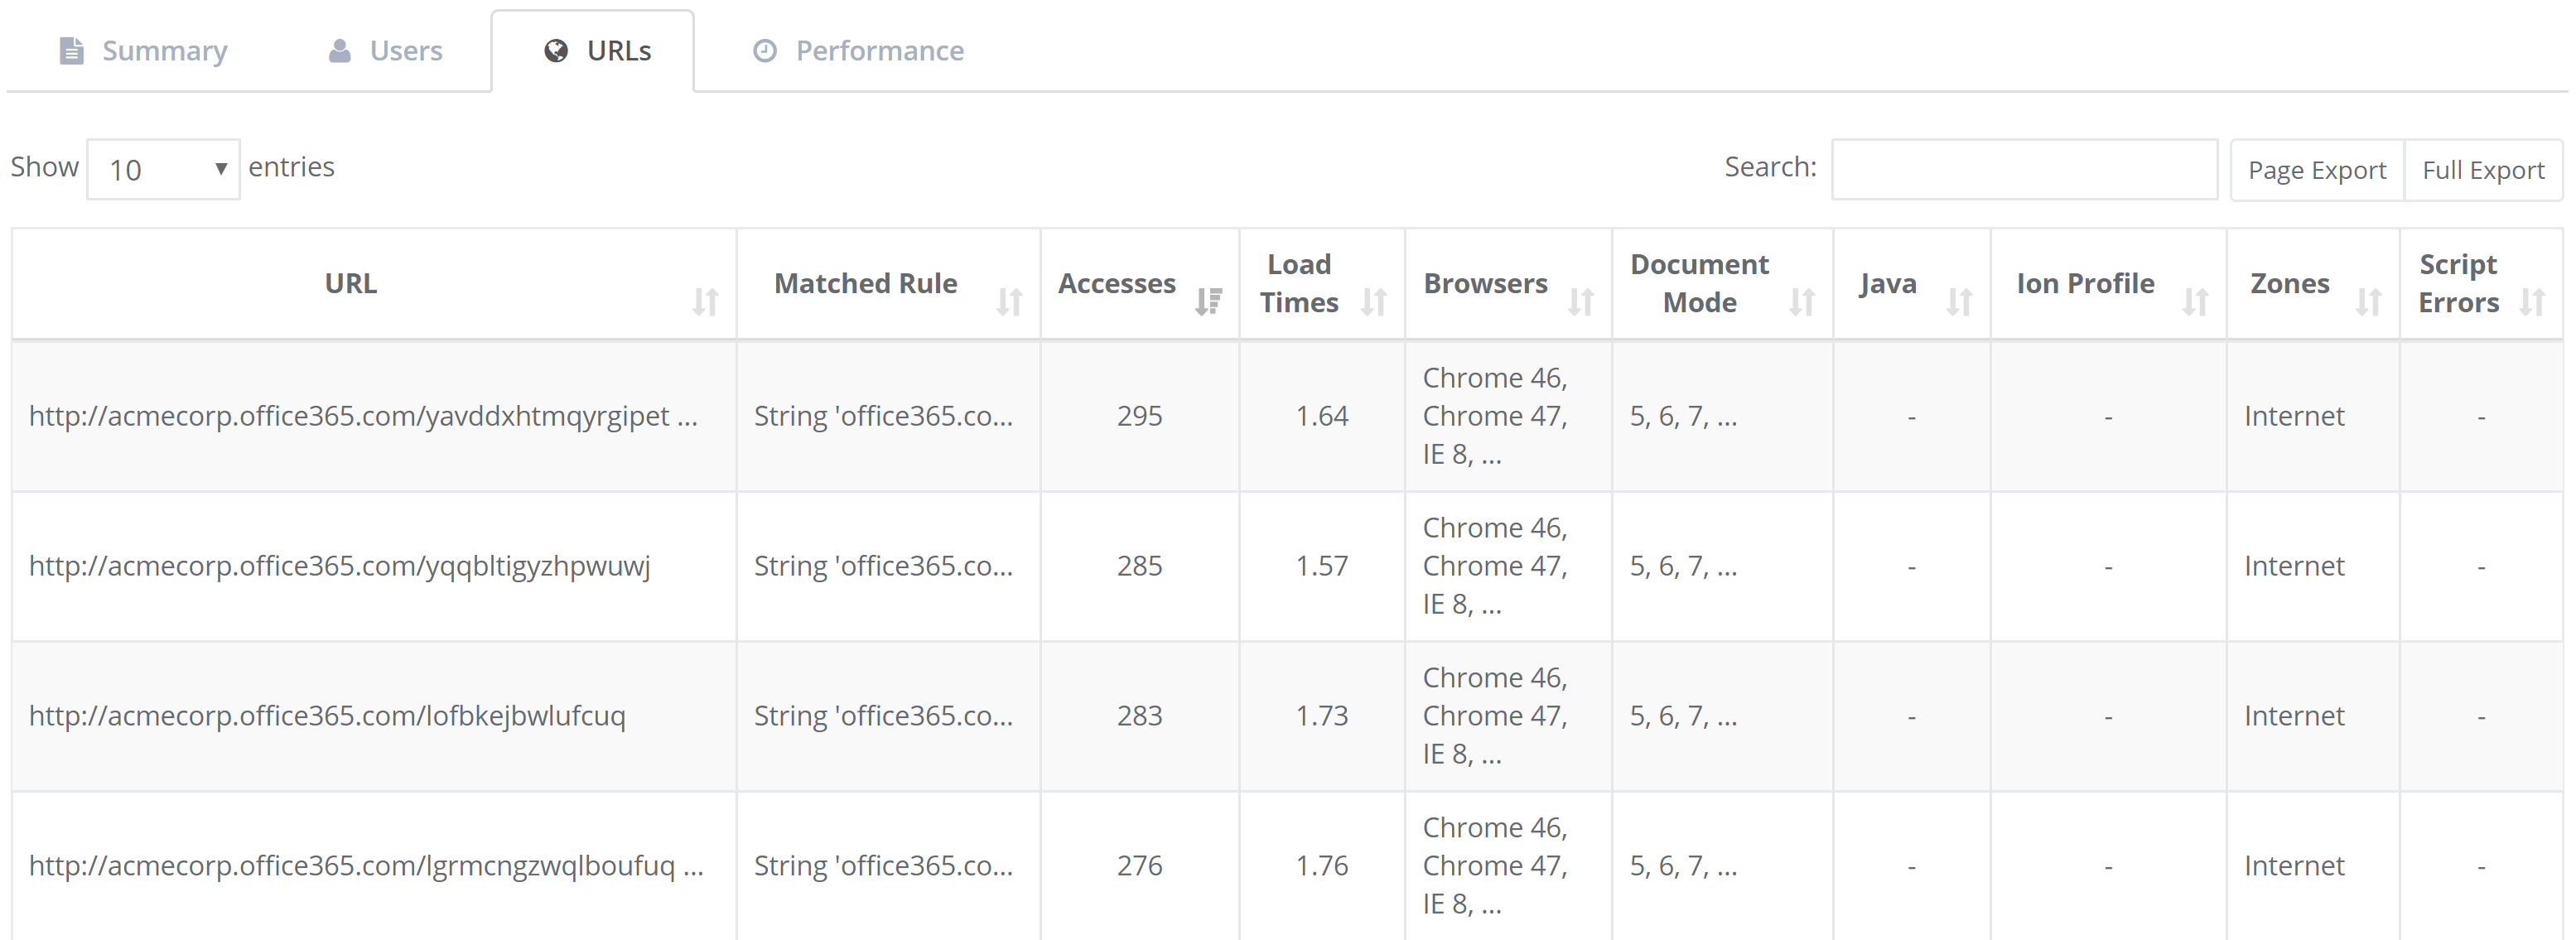 {width=“5.915706474190726in” height=“2.158979658792651in”}
Clicking on any row in the URLs table will display the detailed activity for that URL. You’ll be presented with rows of activity data, each representing a unique access to that web application by an individual user. Complete details of these data tables are found in the Activity for URL section of this guide.
The Performance tab provides detailed graphs of accesses, page load times, and total time for each web application for the period selected in the date picker control. This is called the Performance History report and is detailed in the Performance section of this guide.
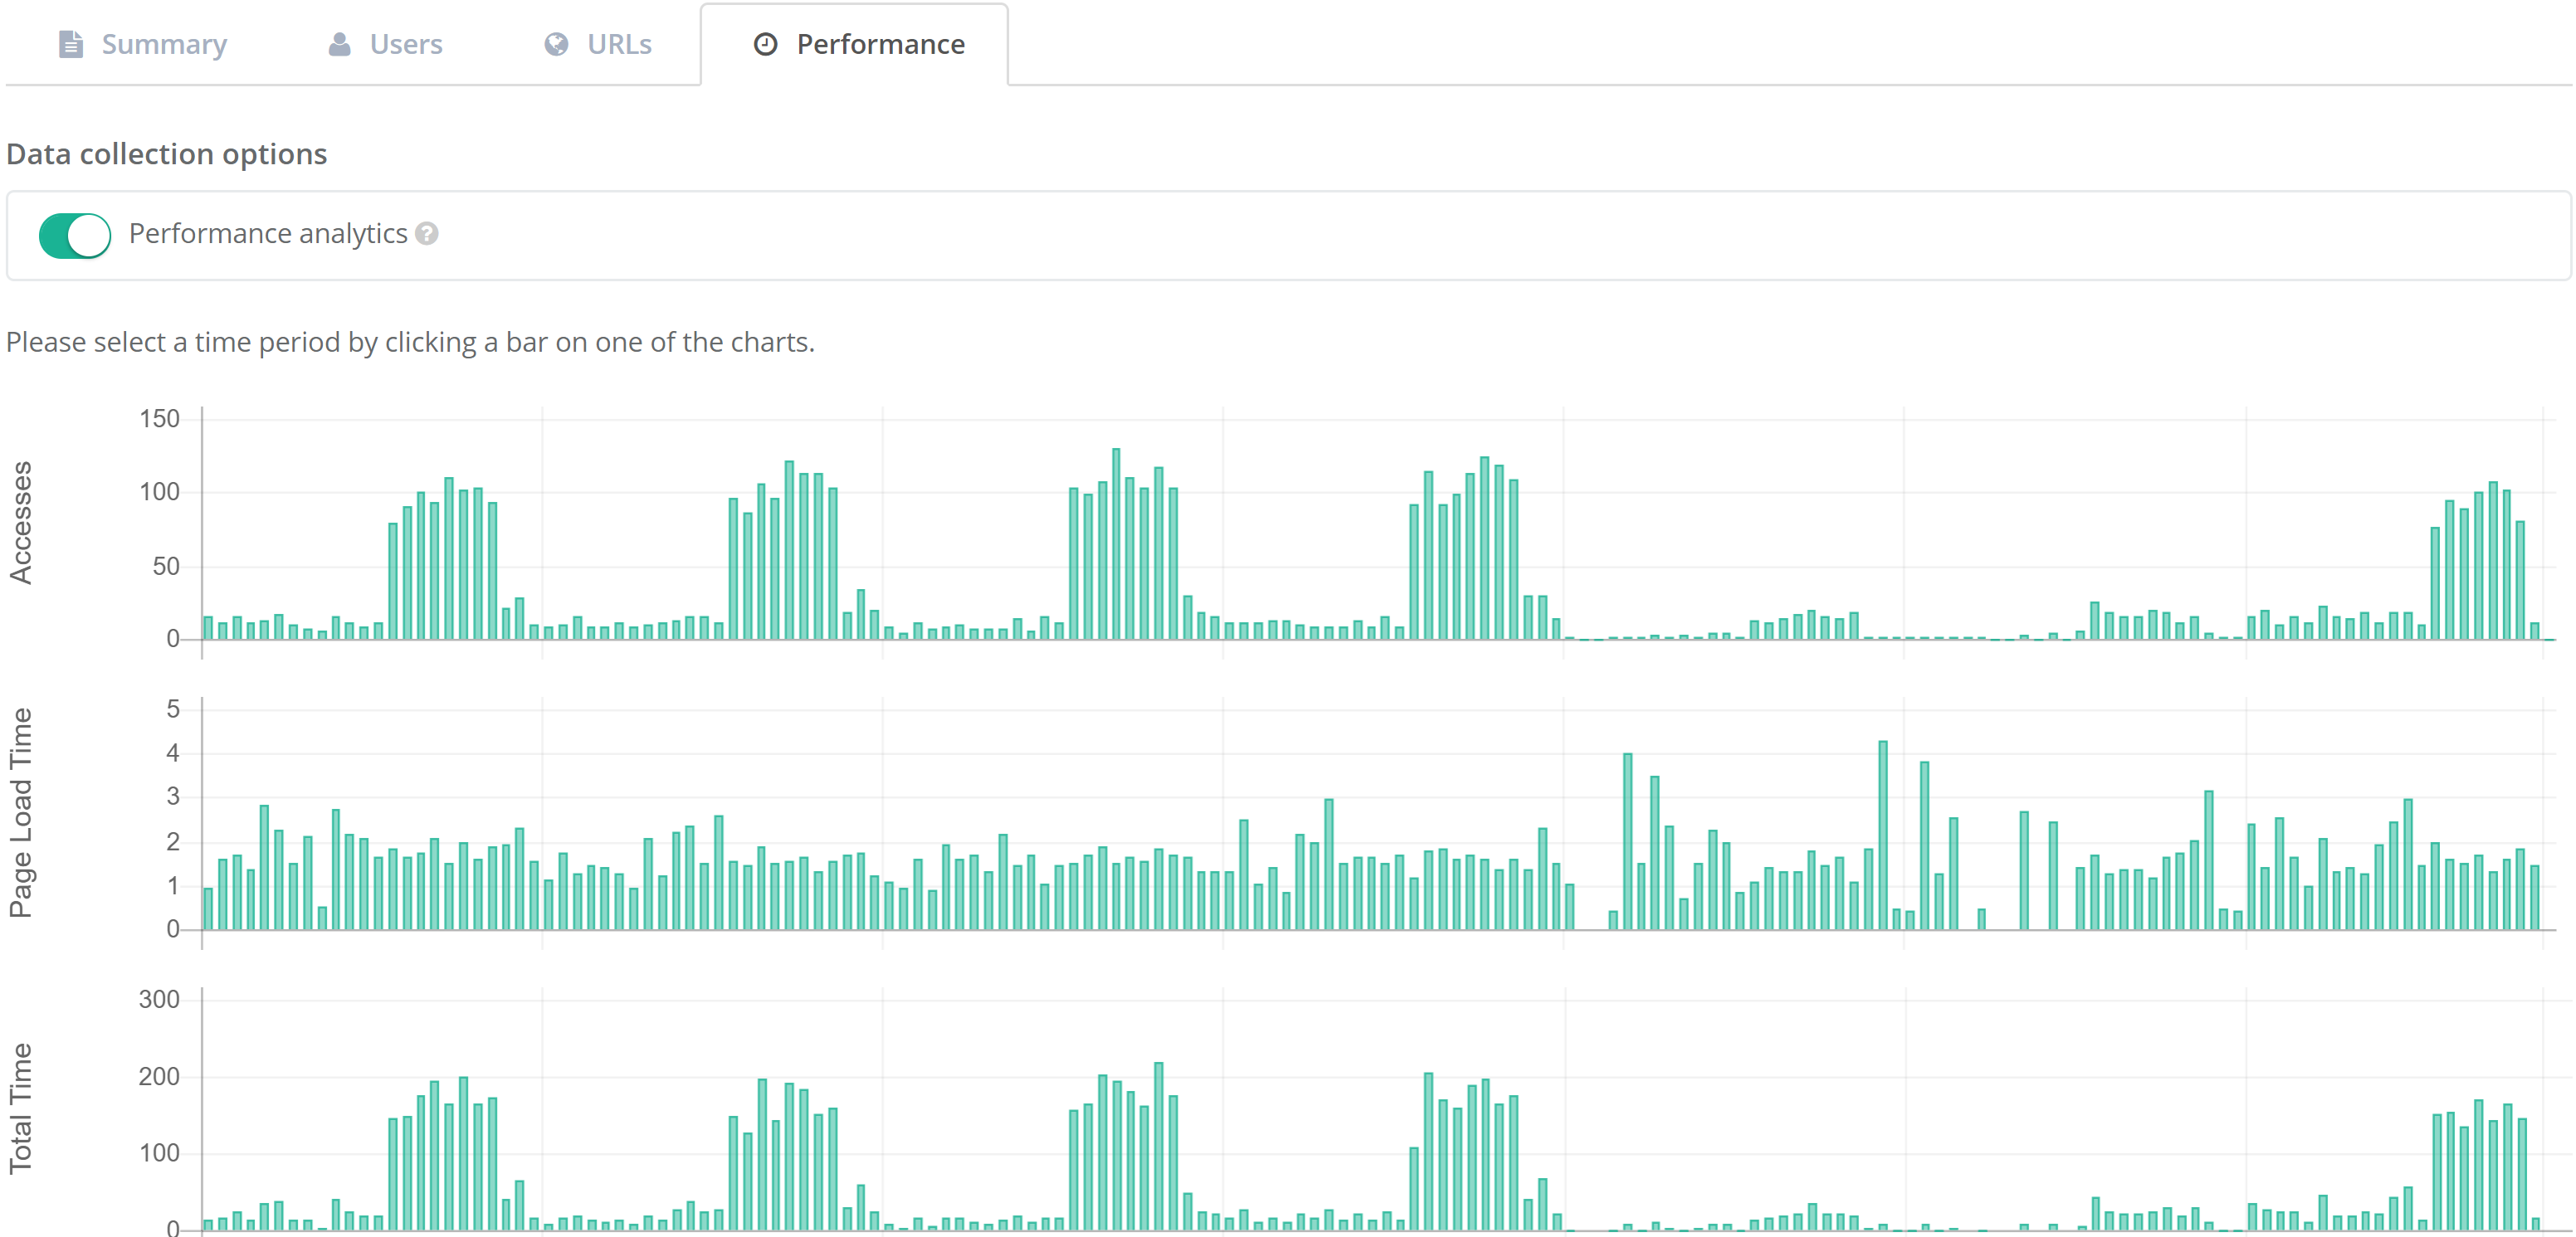 {width=“5.583144138232721in” height=“2.6818175853018373in”}
[]{#_Activity_for_URL .anchor}
Activity for URL
Section titled “Activity for URL”In addition to the details for a given web application, Proton offers an even greater level of detail of each page access. Clicking on any URL value in the Web Application Details page will bring up the Accesses page.
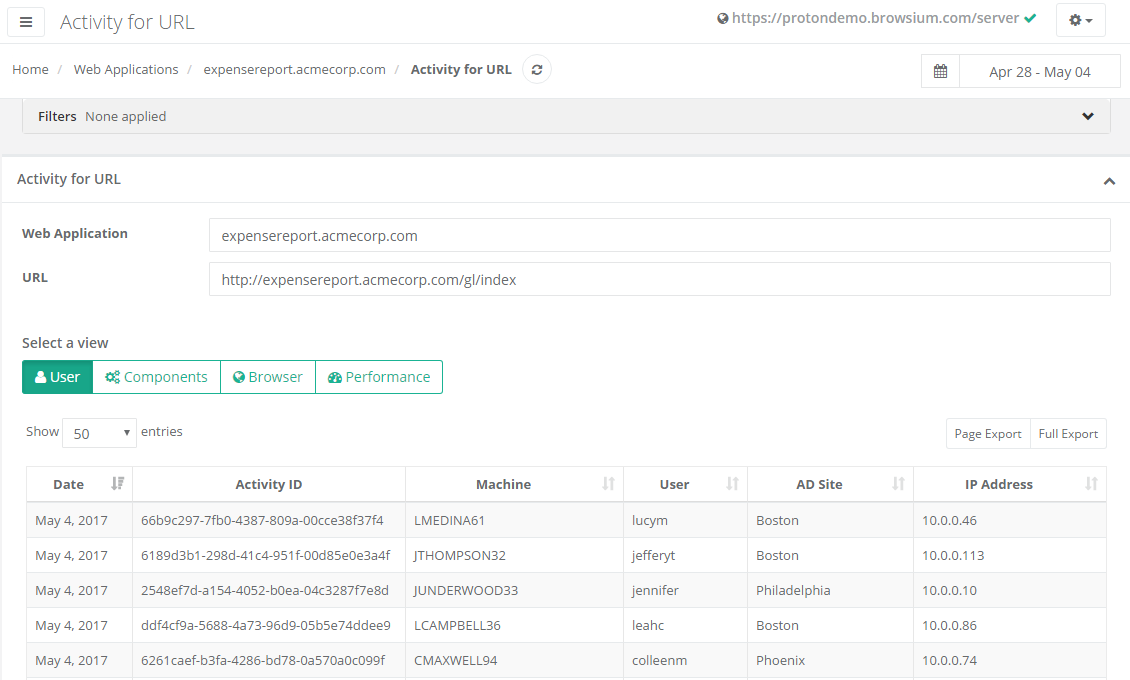 {width=“5.97500656167979in” height=“3.5958562992125986in”}
The default view for the Activity for URL page is the User view, where each row provides detailed info on the URL accessed. The data includes:
-
Date of access
-
Activity ID (an internal Proton value to uniquely identify each navigation)
-
Machine and User information
-
AD Site (if domain joined)
-
IP Address
Proton assigns an Activity ID to each navigation to ensure statistical and analytical consistency for when Privacy features have been enabled. The Activity ID is unique to an action but when Privacy is enabled and user/machine data is anonymized, the Activity ID ensures report and data integrity while maintaining user anonymization.
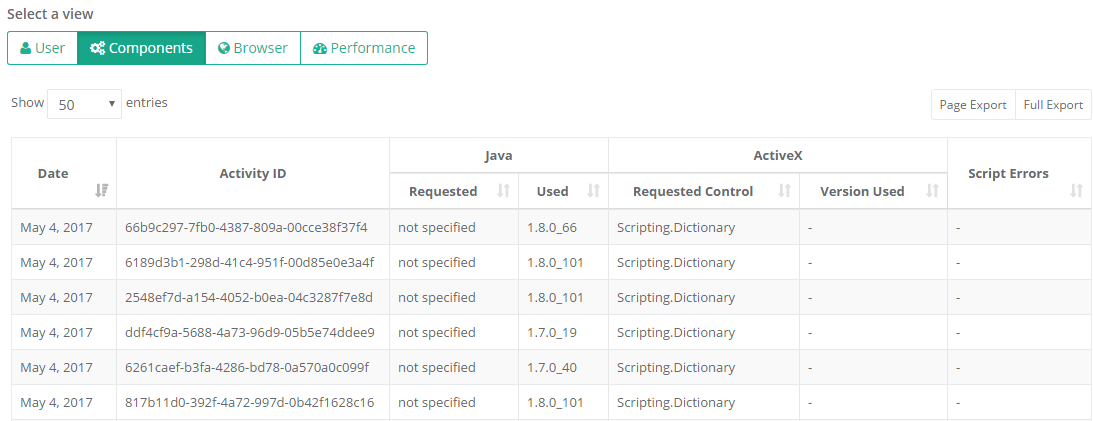
The next view, Components, displays detailed access information of any extension/add-ons used on the given pages. The data includes:
-
Date of access
-
Activity ID (an internal Proton value assigned to navigations)
-
Java Version (Requested and Used)
-
ActiveX Control (Requested and Used
 {width=“6.063549868766404in” height=“2.3353751093613297in”}
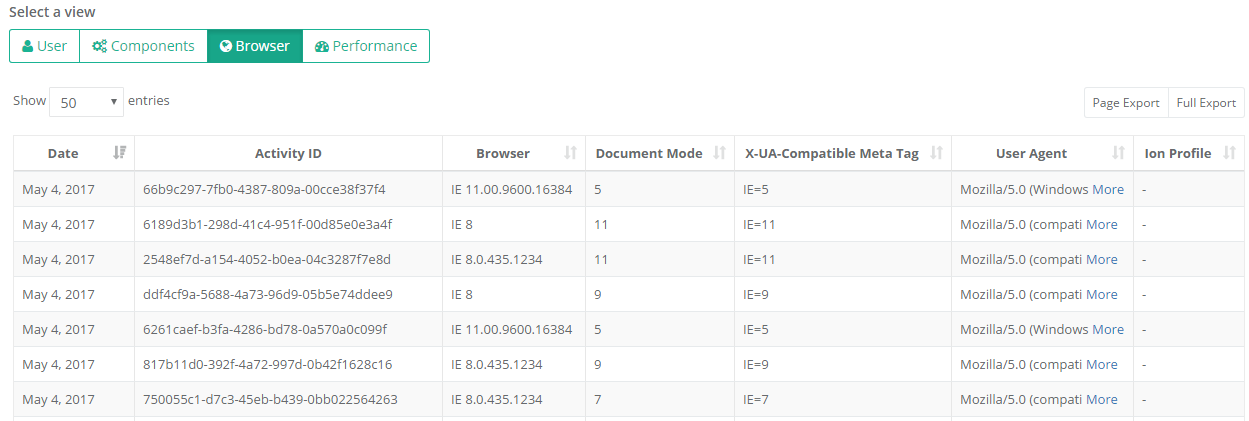
The Browser view provides detailed access information about the browser criteria, modes and settings used to render the given pages. The data includes:
-
Date of access
-
Activity ID (an internal Proton value assigned to navigations)
-
Detailed Browser version number (if greater than IE8)
-
Document Mode (If using Internet Explorer)
-
X-UA Compatible Meta Tag (If using Internet Explorer)
-
User Agent value
-
Ion Profile used (if applicable)
 {width=“6.101673228346456in” height=“2.056707130358705in”}
Switching to the Performance view includes the same date, and Activity ID, as well as more details on specific page load timing behaviors.
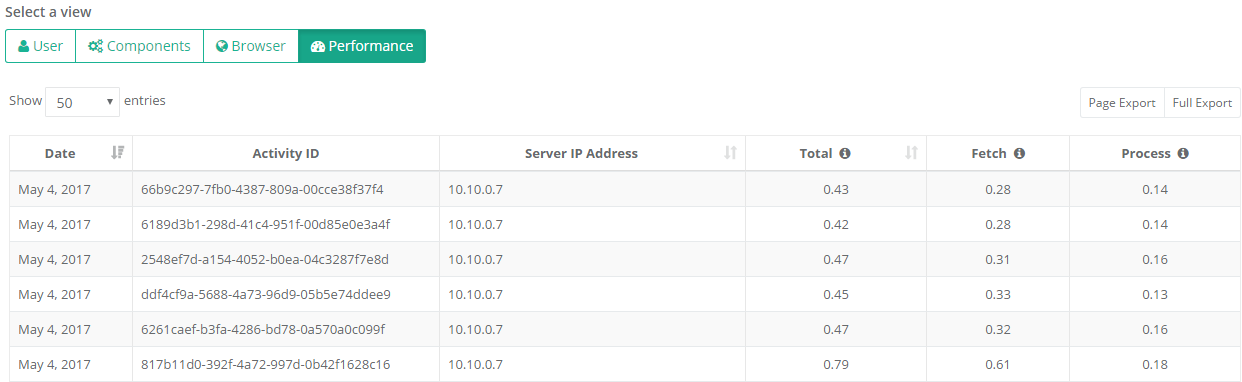 {width=“6.044407261592301in” height=“1.8591721347331585in”}
The Total column provides information on the total page load time (in seconds). Total page load is defined as the sum of the Fetch and Process times.
The Fetch column shows the time to retrieve the page (in seconds). The Fetch value is calculated from the time the navigation begins until the response is ended.
The Process column provides the time to process and render the page (in seconds). The Process value is calculated from the time the response is ended until the DOM is completely loaded.
Performance
Section titled “Performance”Understanding how web applications are performing in your environment is essential to running an efficient enterprise. Business critical web applications suffering from poor performance can have a very significant cost impact to your company from lost end user productivity and generation of support tickets. For web applications used by employees in customer facing disciplines (e.g., customer support, sales, etc.), performance problems with the web application can directly impact the customer’s experience with the company and the bottom line. On the IT side, web applications that are not scaled correctly for their loads can likewise have a significant cost in time and attention of IT employees due to extra monitoring and frequent emergency maintenance activity.
Proton provides a very simple and powerful set of data and insights to assist you in troubleshooting and isolating web application performance issues, as seen by the actual client endpoints in your enterprise, at a granular level. Using this data, you can determine if performance problems exists on web applications for a single user, grouping of users, geographic basis, or if the issue is impacted by time of day or even by other browsing activity. This data identifies issues and anomalies that would otherwise be invisible to existing performance monitoring solutions.
Proton achieves this by collecting detailed performance metrics, including how long each page load takes on each client PC. With this data, Proton can summarize the performance of multiple web applications, including historical and current page load times, and surface how the current load times compare with the historical average. This is displayed on the main Performance page in the Activity section.
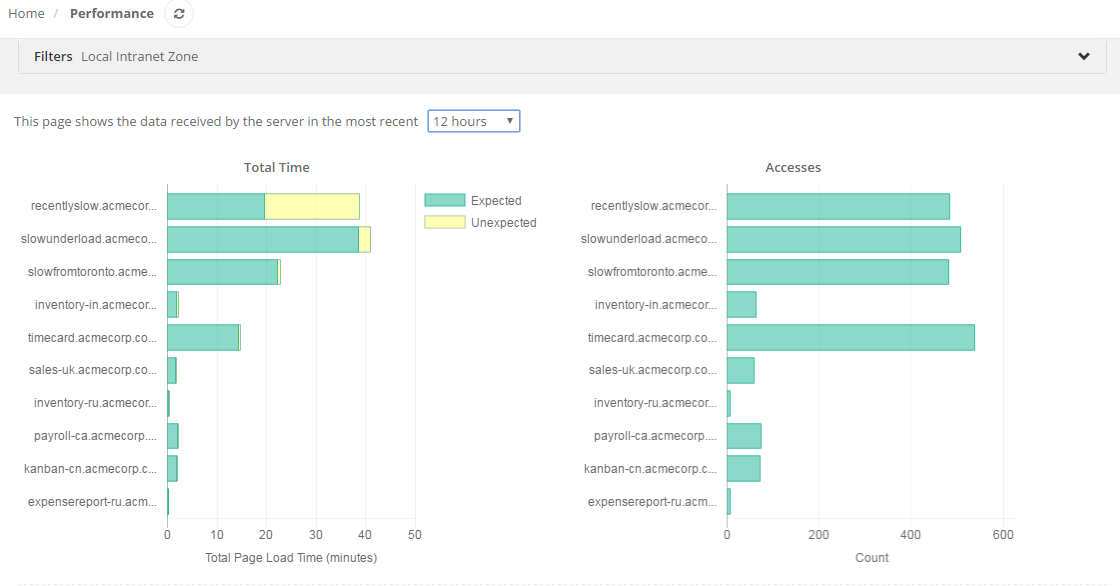 {width=“5.983715004374453in” height=“3.130582895888014in”}
The charts on this page allow you to quickly answer questions about web application performance in your enterprise. The chart on the left (Total Time) shows the total amount of time in minutes that end users are currently spending in each web application waiting for pages to load. This is a compound measurement that takes into account both the frequency of use and the speed of the web application, allowing you to focus on performance issues for the web applications that matter most to your organization. The green bar is the “expected” total time, based on the historical mean, while the yellow represents the “unexpected” total time, in excess of the historical mean. This allows you to answer the question — “which frequently used applications in my enterprise are currently significantly slower than usual?” — and gives you the ability to drill down and find out why.
The chart on the right (Accesses), shows total number of accesses for each web application. The higher the count, the more popular, or heavily used, the web application is — and the more relevant it is to your organization. If you see an application with a moderate yellow bar (unexpected load time) in the chart on the left, but a very high accesses count in the chart on the right, troubleshooting may be a high priority as a lot of users, or a smaller set of very active users, are affected. Conversely, if you see an application with a large unexpected load time in the chart on the left, but a small number of accesses on the right, that tells you that this application is currently much slower than its historical average, but not very heavily used, and therefore may be a lower priority for troubleshooting.
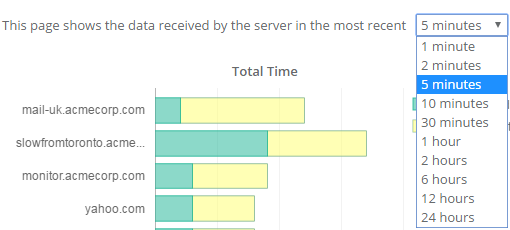
You can control the time interval using the dropdown above the charts. The default time interval is 5 minutes. A good practice is to set the time interval to be roughly 50% of the data push interval, set on the Configuration page.
 {width=“4.111410761154856in” height=“1.85416447944007in”}
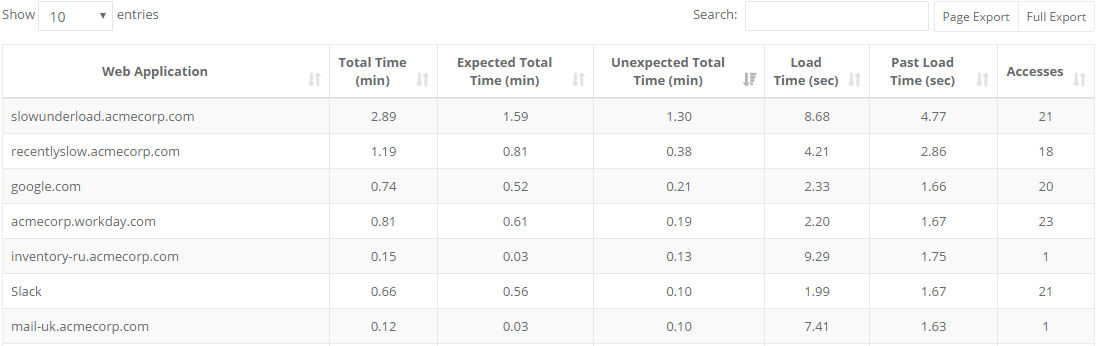
As with most charts in Proton, the underlying table is sortable by any column and will affect the chart display. By default, the table is sorted by Unexpected Load Time, with the highest first by default. When you sort the table by Total Time (descending), the charts allow you to answer the question “where are my employees currently spending the most time?”. You can also filter the table using the Filters at the top of the page or by searching for a specific web application using the Search box.
 {width=“5.9627569991251095in” height=“1.877376421697288in”}
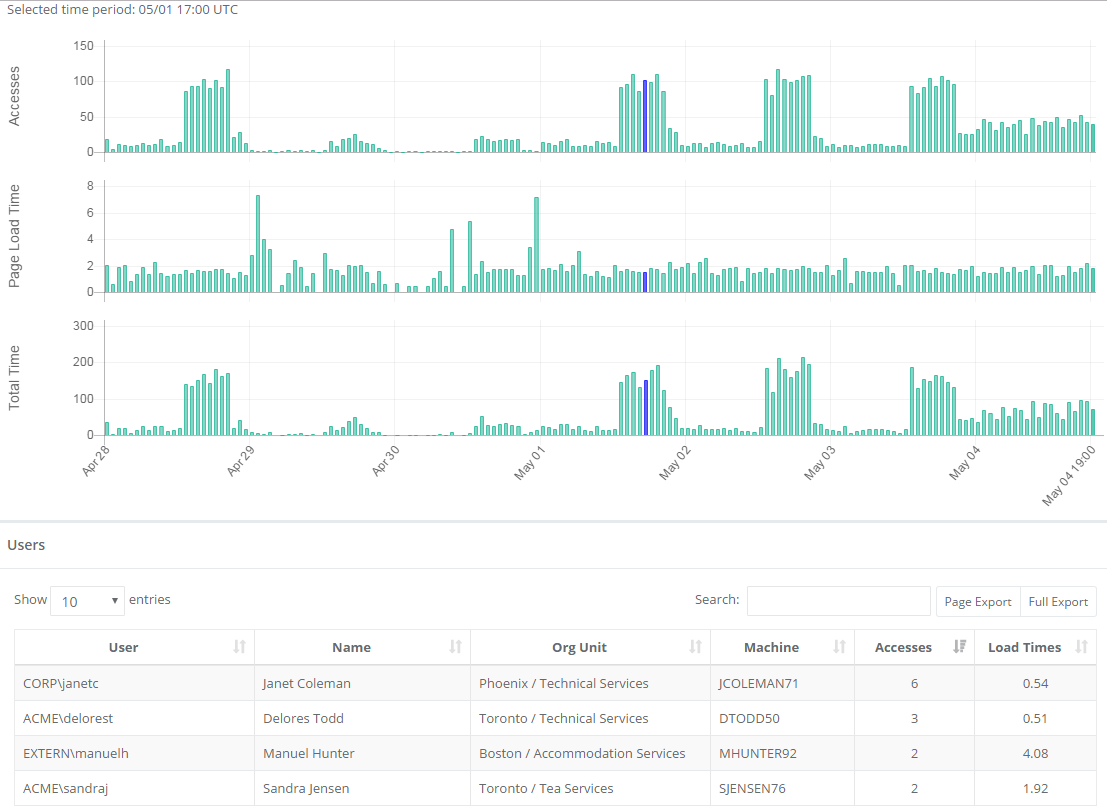
Selecting any row in the table will look up the activity detail for that web application, displaying the Performance History report (also found in the Performance tab within the Web Application Details View in section 3.3.1.4).
 {width=“5.9350371828521435in” height=“3.574971566054243in”}
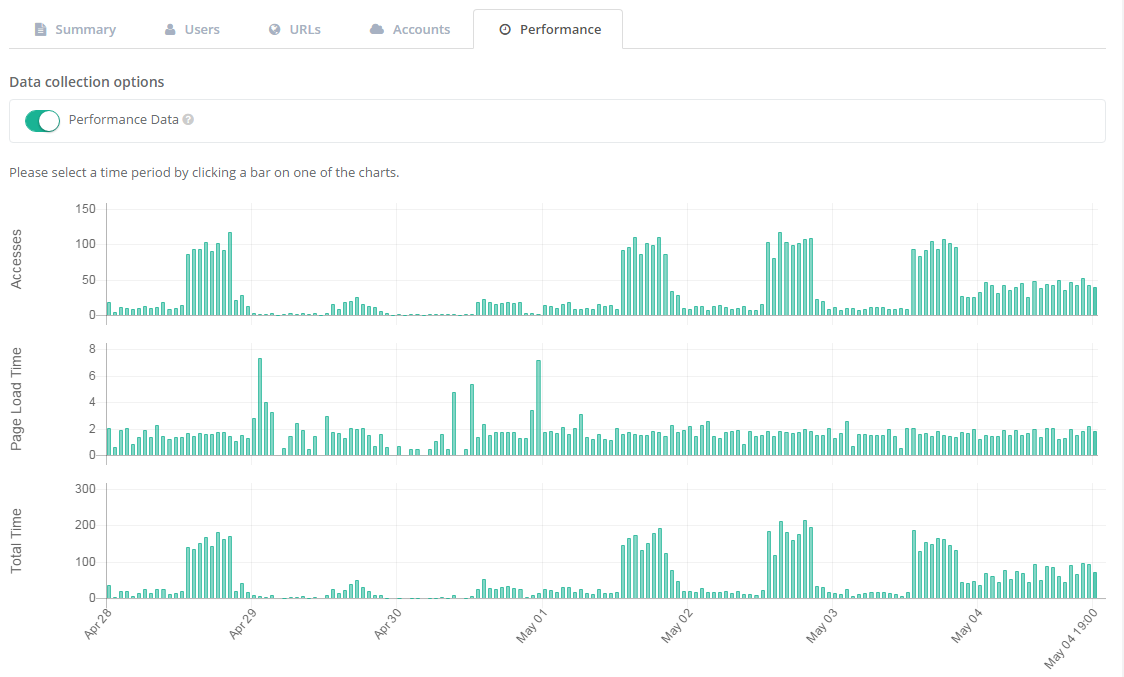
The Performance History report is a quick and easy way to recognize patterns in performance over time for any given web application. On this page, you see a compound chart that displays number of accesses, page load time, and total time at an hourly granularity. Selecting any time period on the charts will highlight that period across all three charts and display a set of tables under the charts with the user and access details for that time period. Selecting anywhere else on the chart will de-select that time period.
 {width=“5.911337489063867in” height=“4.304035433070866in”}
Because these three charts are synchronized on the axis of time, it’s easy to see your usage patterns for the web application — time of day, days of the week, along with the corresponding performance of the web application. For example, if you see that a web application page load time tends to increase regularly as accesses increase, you might want to look further at whether that web application is scaled appropriately for its load. These charts are also subject to the same top-level filters as many other pages in Proton Manager, so it’s easy to restrict the data to slices of your enterprise by geography, network topography, org unit, browser, or individual and see how the patterns change. This can help you diagnose performance issues affecting specific individuals, locations, or business units.
After identifying an interesting time slice, the tables below contain the data that you need to dive in and analyze the issue in more detail. As with other tables in Proton, you can even export the data to do more complex analytics in a tool of your choice.
With the many uses of Java, detailed reporting becomes critical. Accordingly, this report includes several breakout tabs to offer easily consumed views of the complex use cases for Java. The tab options are Attempts by URL, Activity by Version, Activity by URL, Ion Remediation, and Requested vs. Used. The Java report provides a view of all discrete Java versions used across all Proton client systems.
On the Activity by URL, Ion Remediation and Requested vs. Used views, Clicking the link in the URL column will copy that value to the clipboard. Clicking any other data in that row brings up the Access detail page view for that URL.
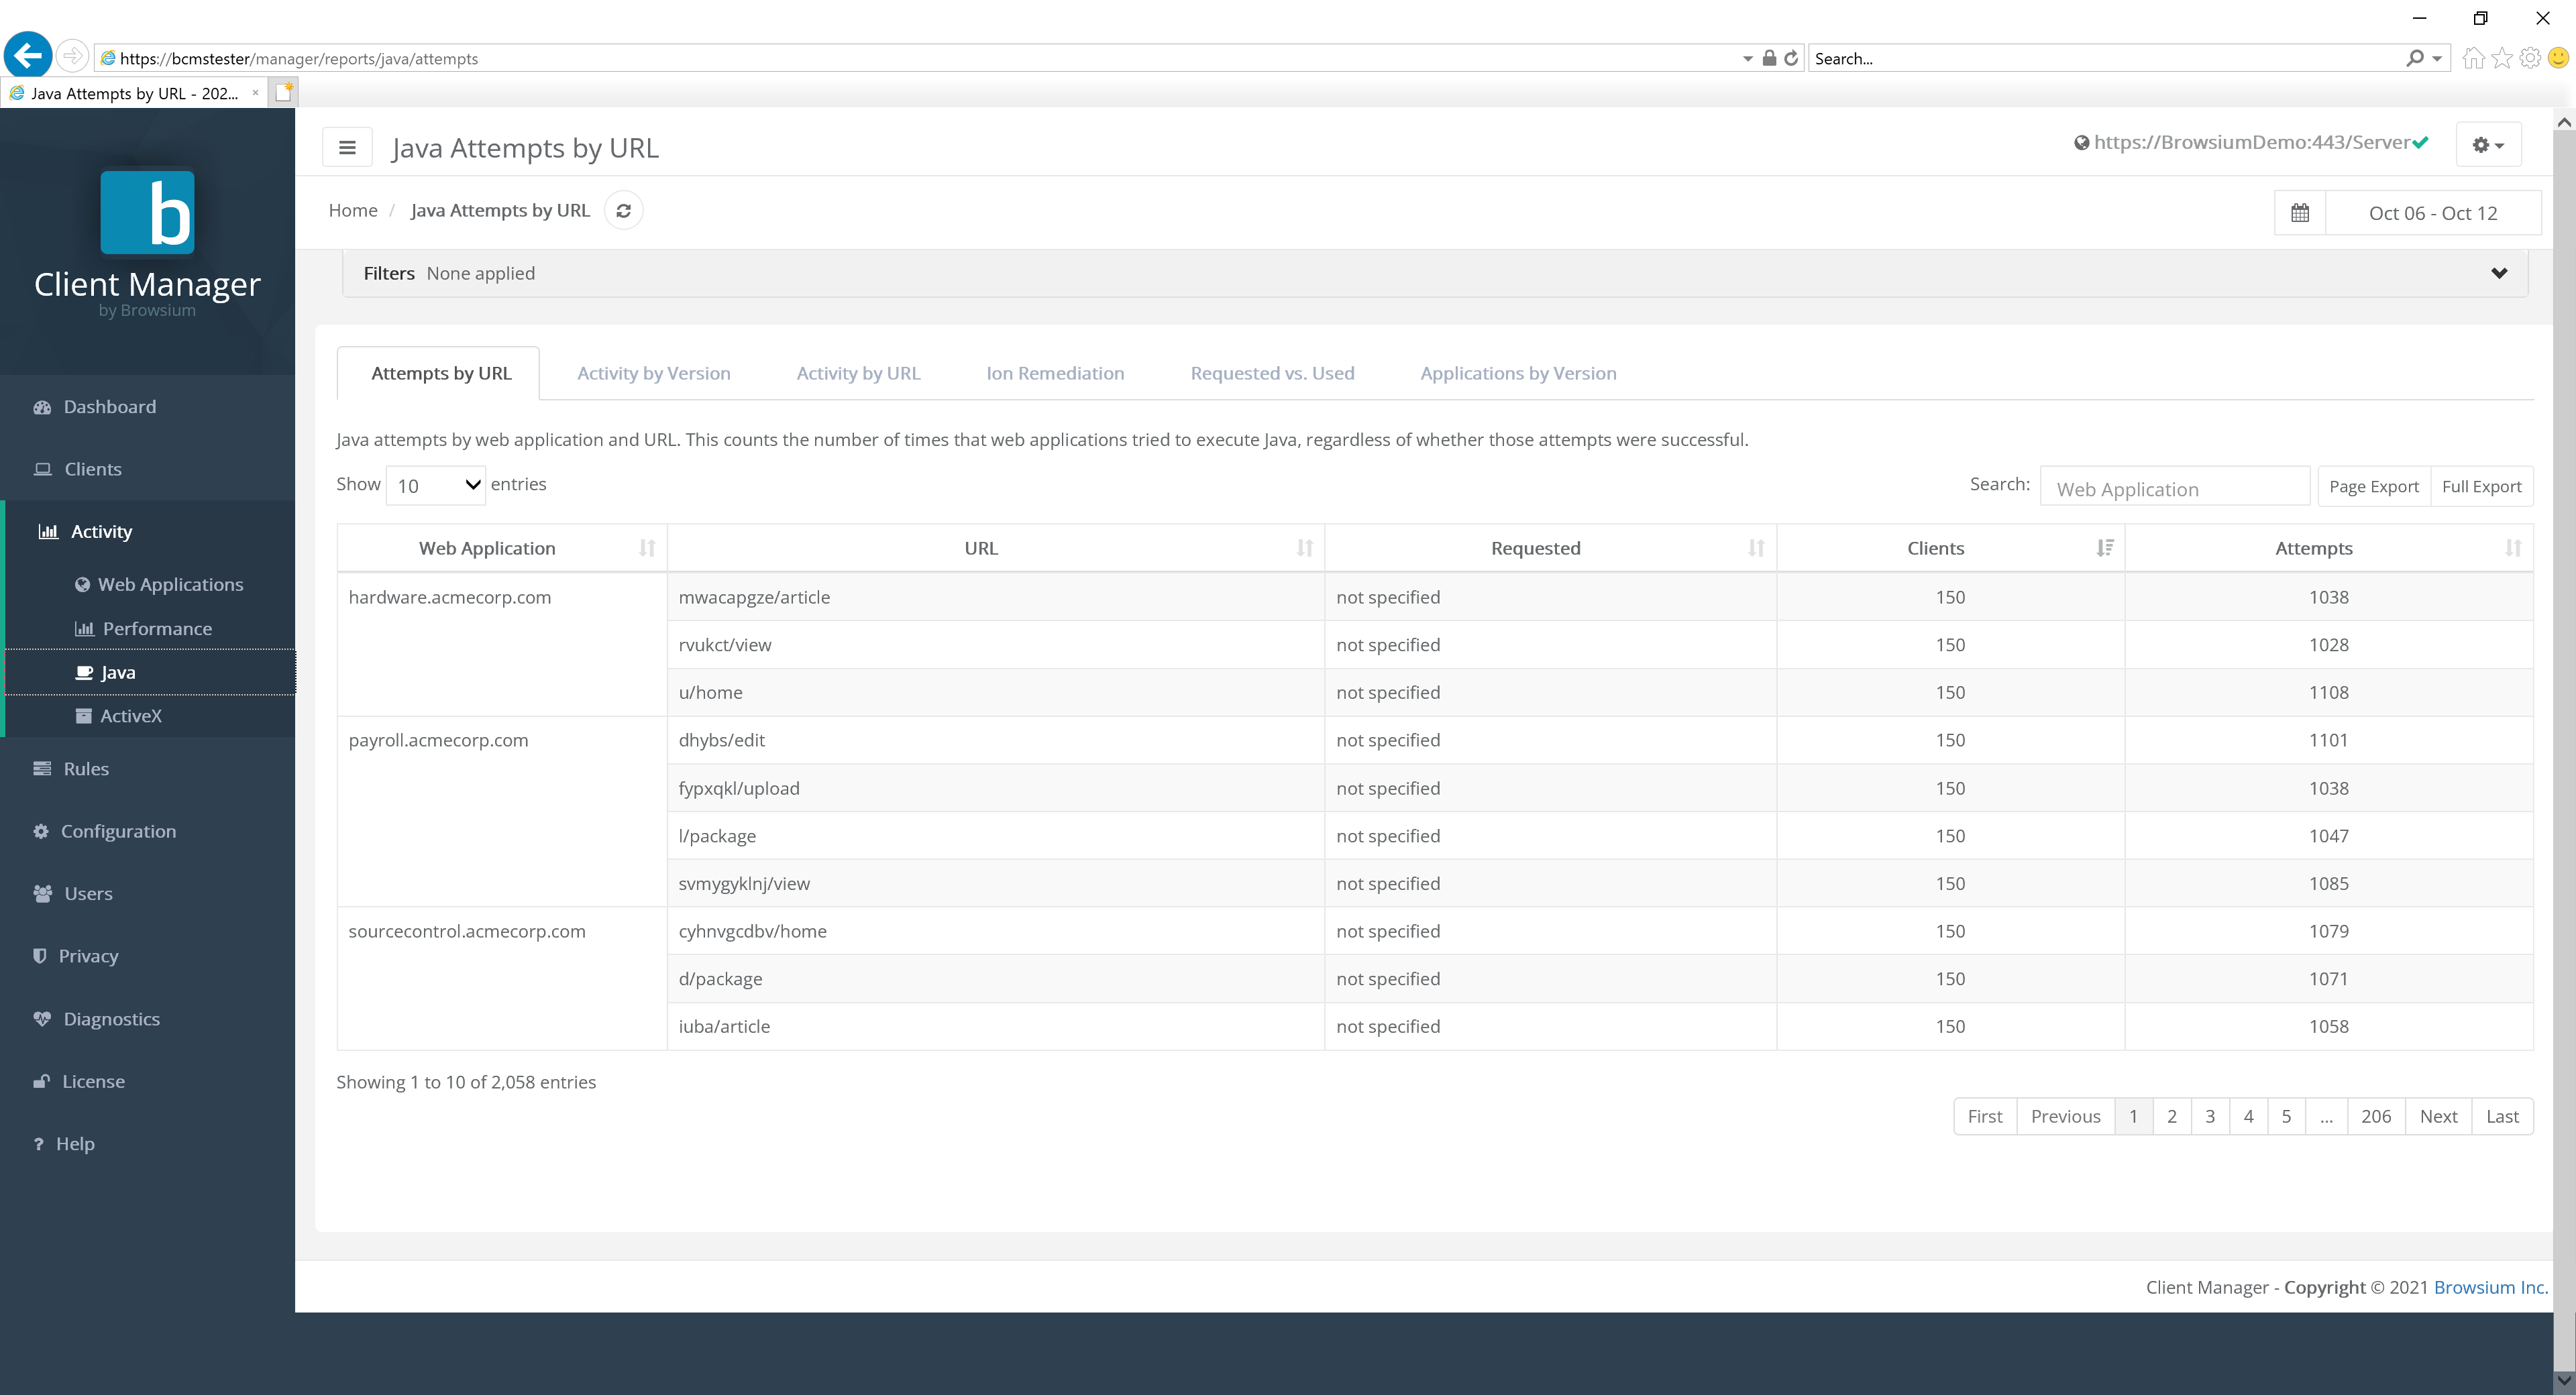
Java Attempts by URL
Section titled “Java Attempts by URL”The default view for Java is attempts by URL:
 {width=“6.225125765529309in” height=“2.5660553368328958in”}
This view provides a detail count the number of times that web applications try to execute Java, regardless of whether those attempts were successful.
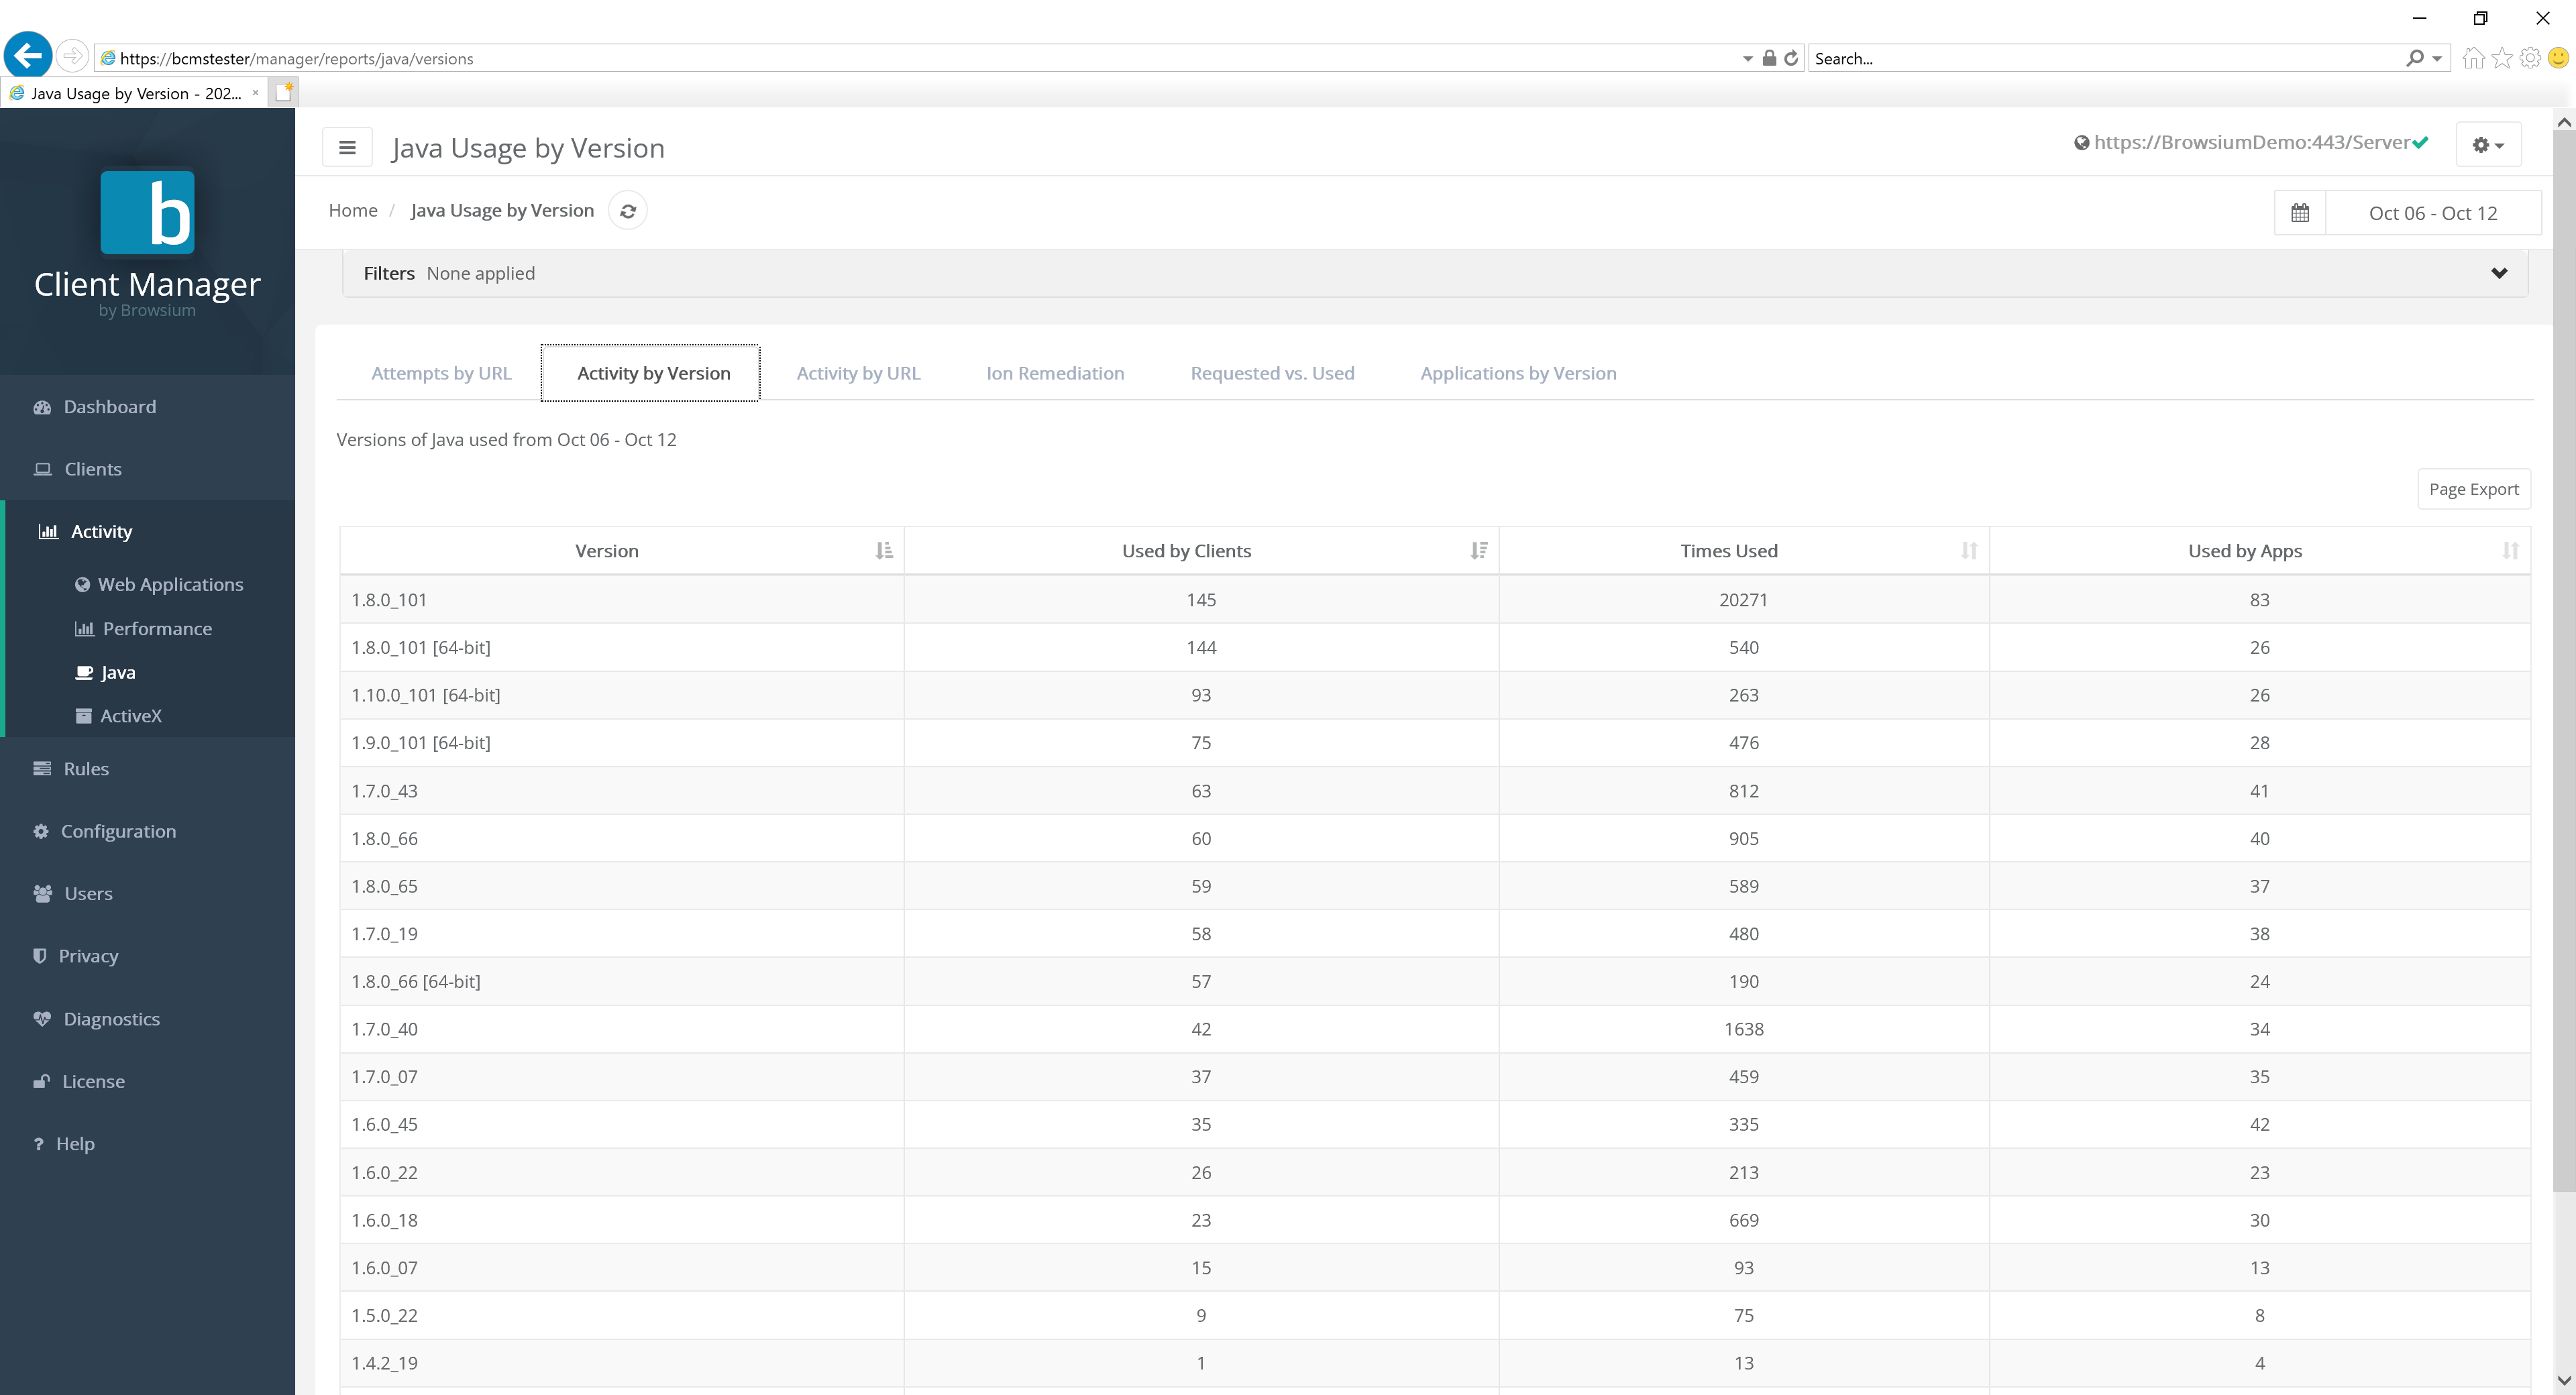
Java Activity by Version
Section titled “Java Activity by Version”Each row represents a unique Java version.
 {width=“6.182548118985127in” height=“2.970324803149606in”}
Clients indicates the total number of clients that have that version of Java installed. This is useful for answering the question “What’s the most prevalent version of Java installed in my org?”
Times Used is a count of how many times that version of Java has been instantiated by clients. This is useful for answering the question “What’s the most used version of Java in my org?”
The Used by Apps column indicates the number of distinct applications that have used that version of Java. This is useful for answering the question “What is the version of Java that most applications use?”
Java Activity by URL
Section titled “Java Activity by URL”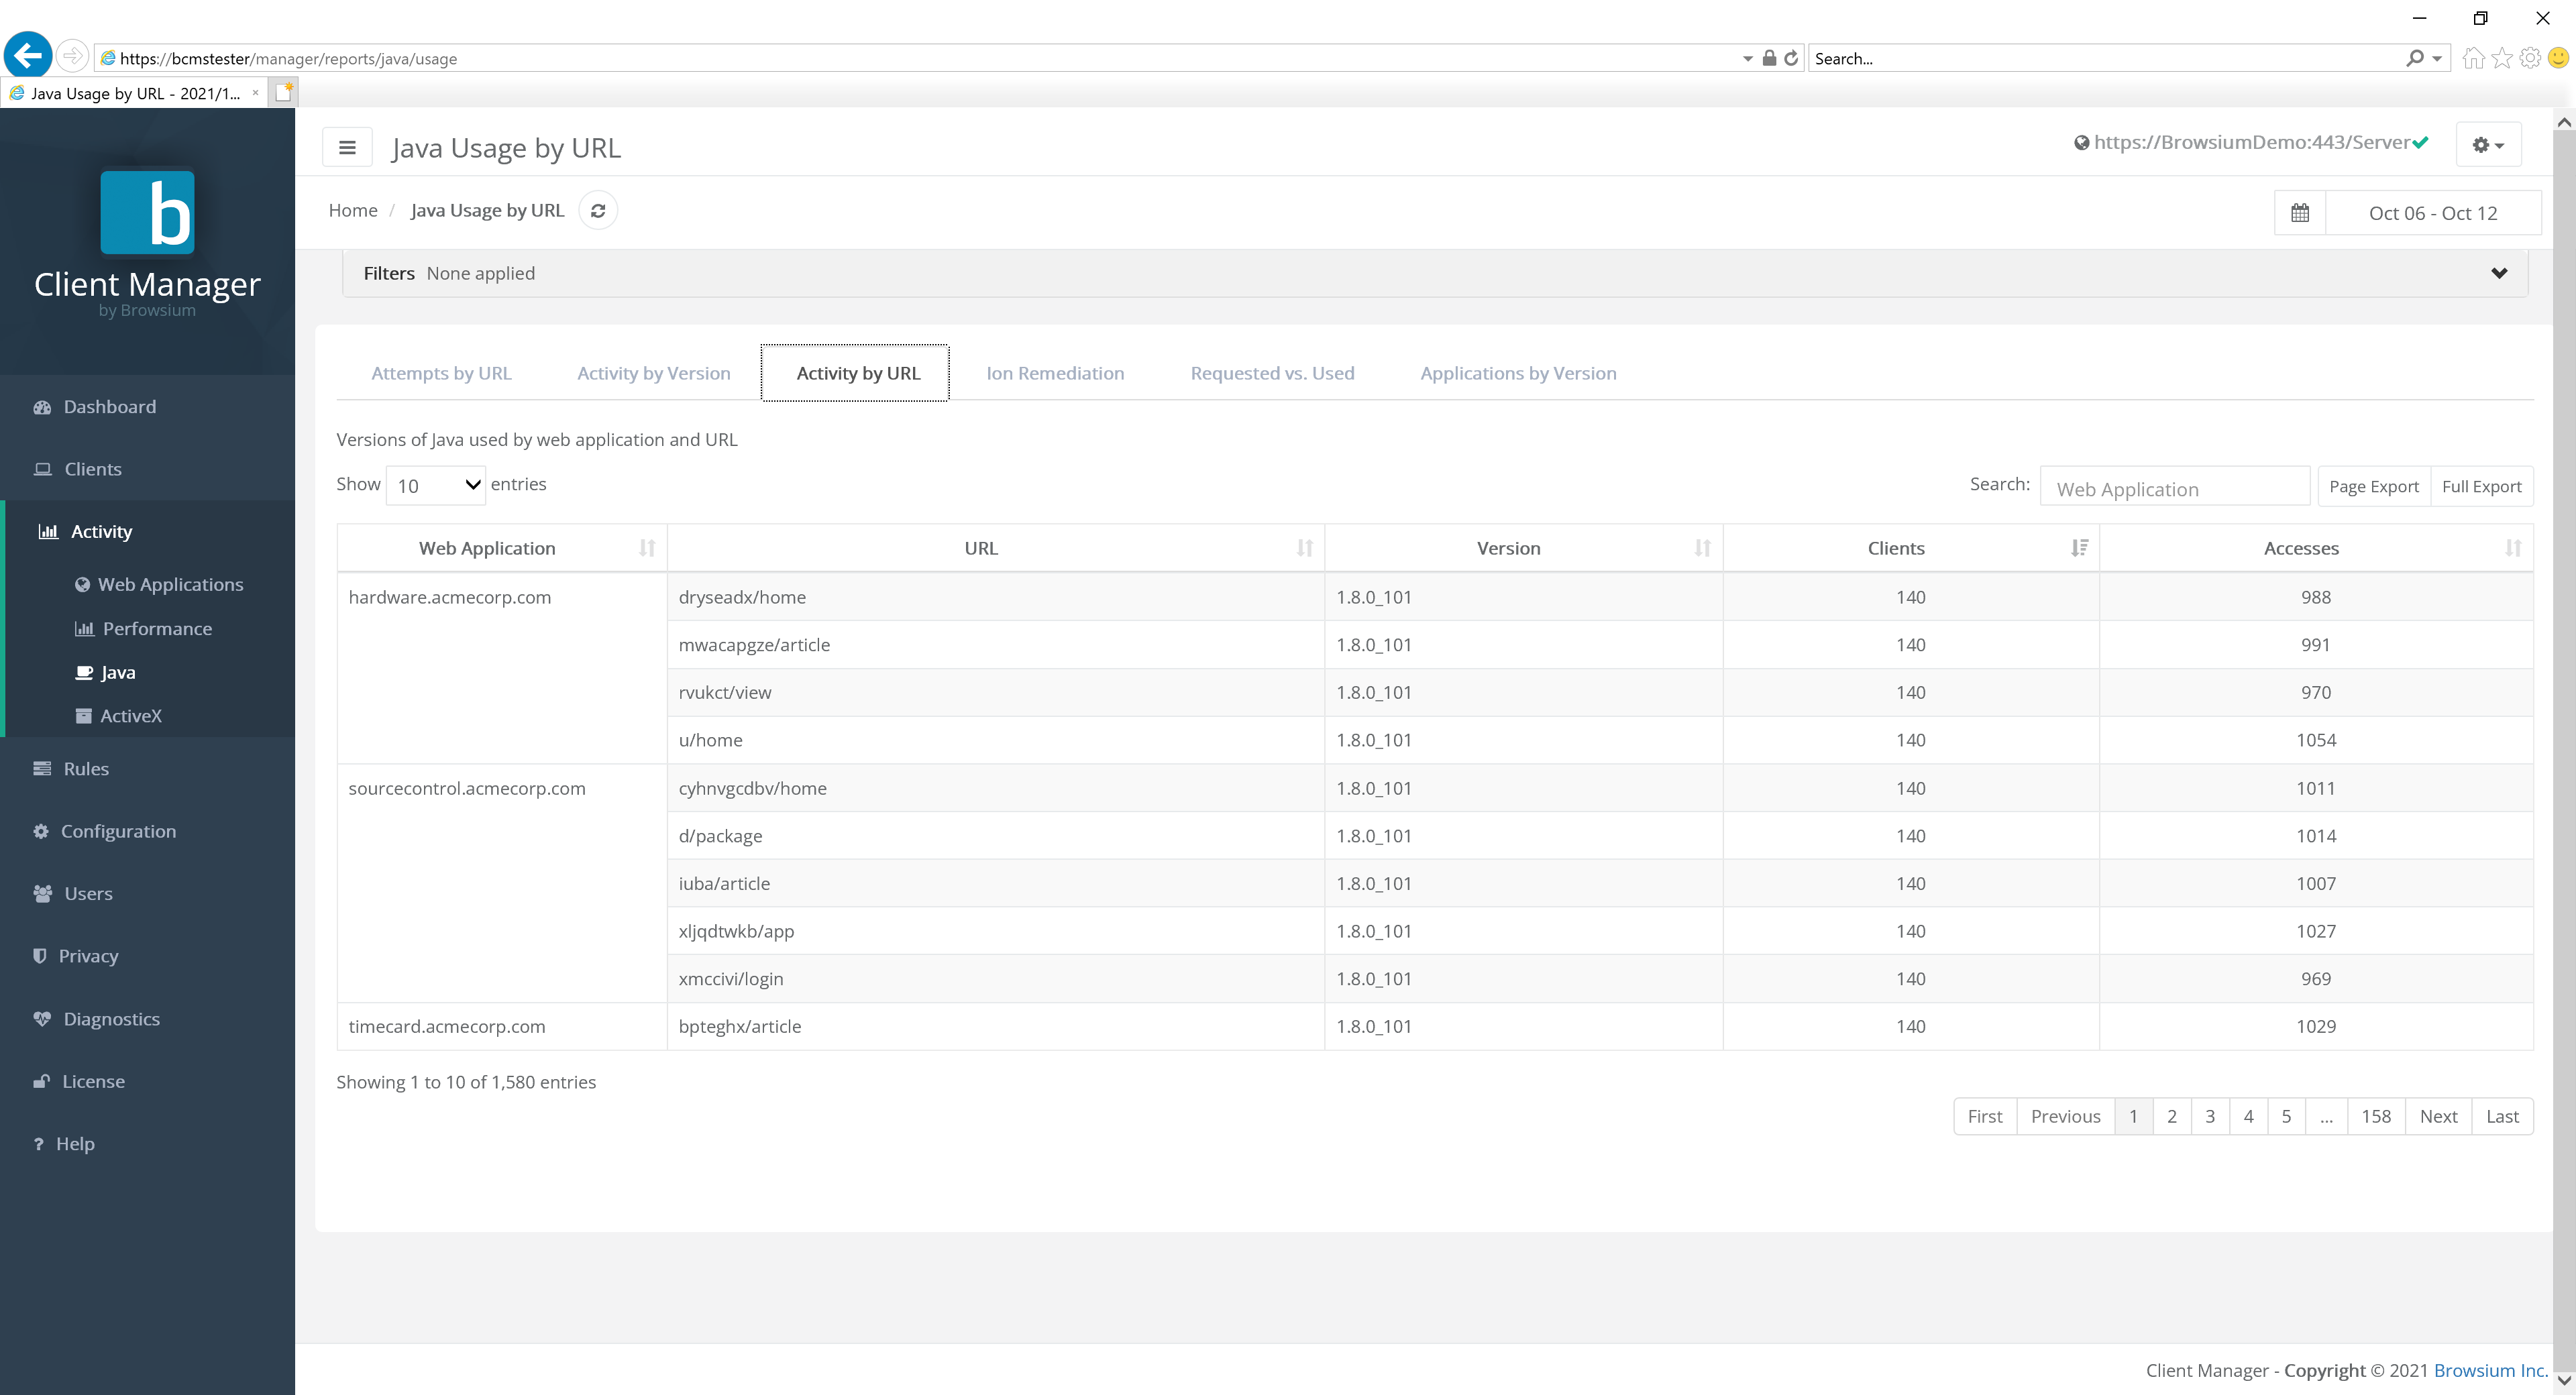 {width=“5.698557524059493in” height=“2.371897419072616in”}
Each row represents a web application as a group of URLs, all of which are broken out within the grouped row.
URL is the specific and detailed list of all URL associated with the specific web application.
The Version column displays which Java version was used by the specified URL. Clicking this item brings up the Access detail page view for that URL.
Clients indicates the total number of clients that have that version of Java installed. This is useful for answering the question “What’s the most prevalent version of Java installed in my org?”
The Accesses column displays the number of times that URL was accessed.
Java Ion Remediation
Section titled “Java Ion Remediation”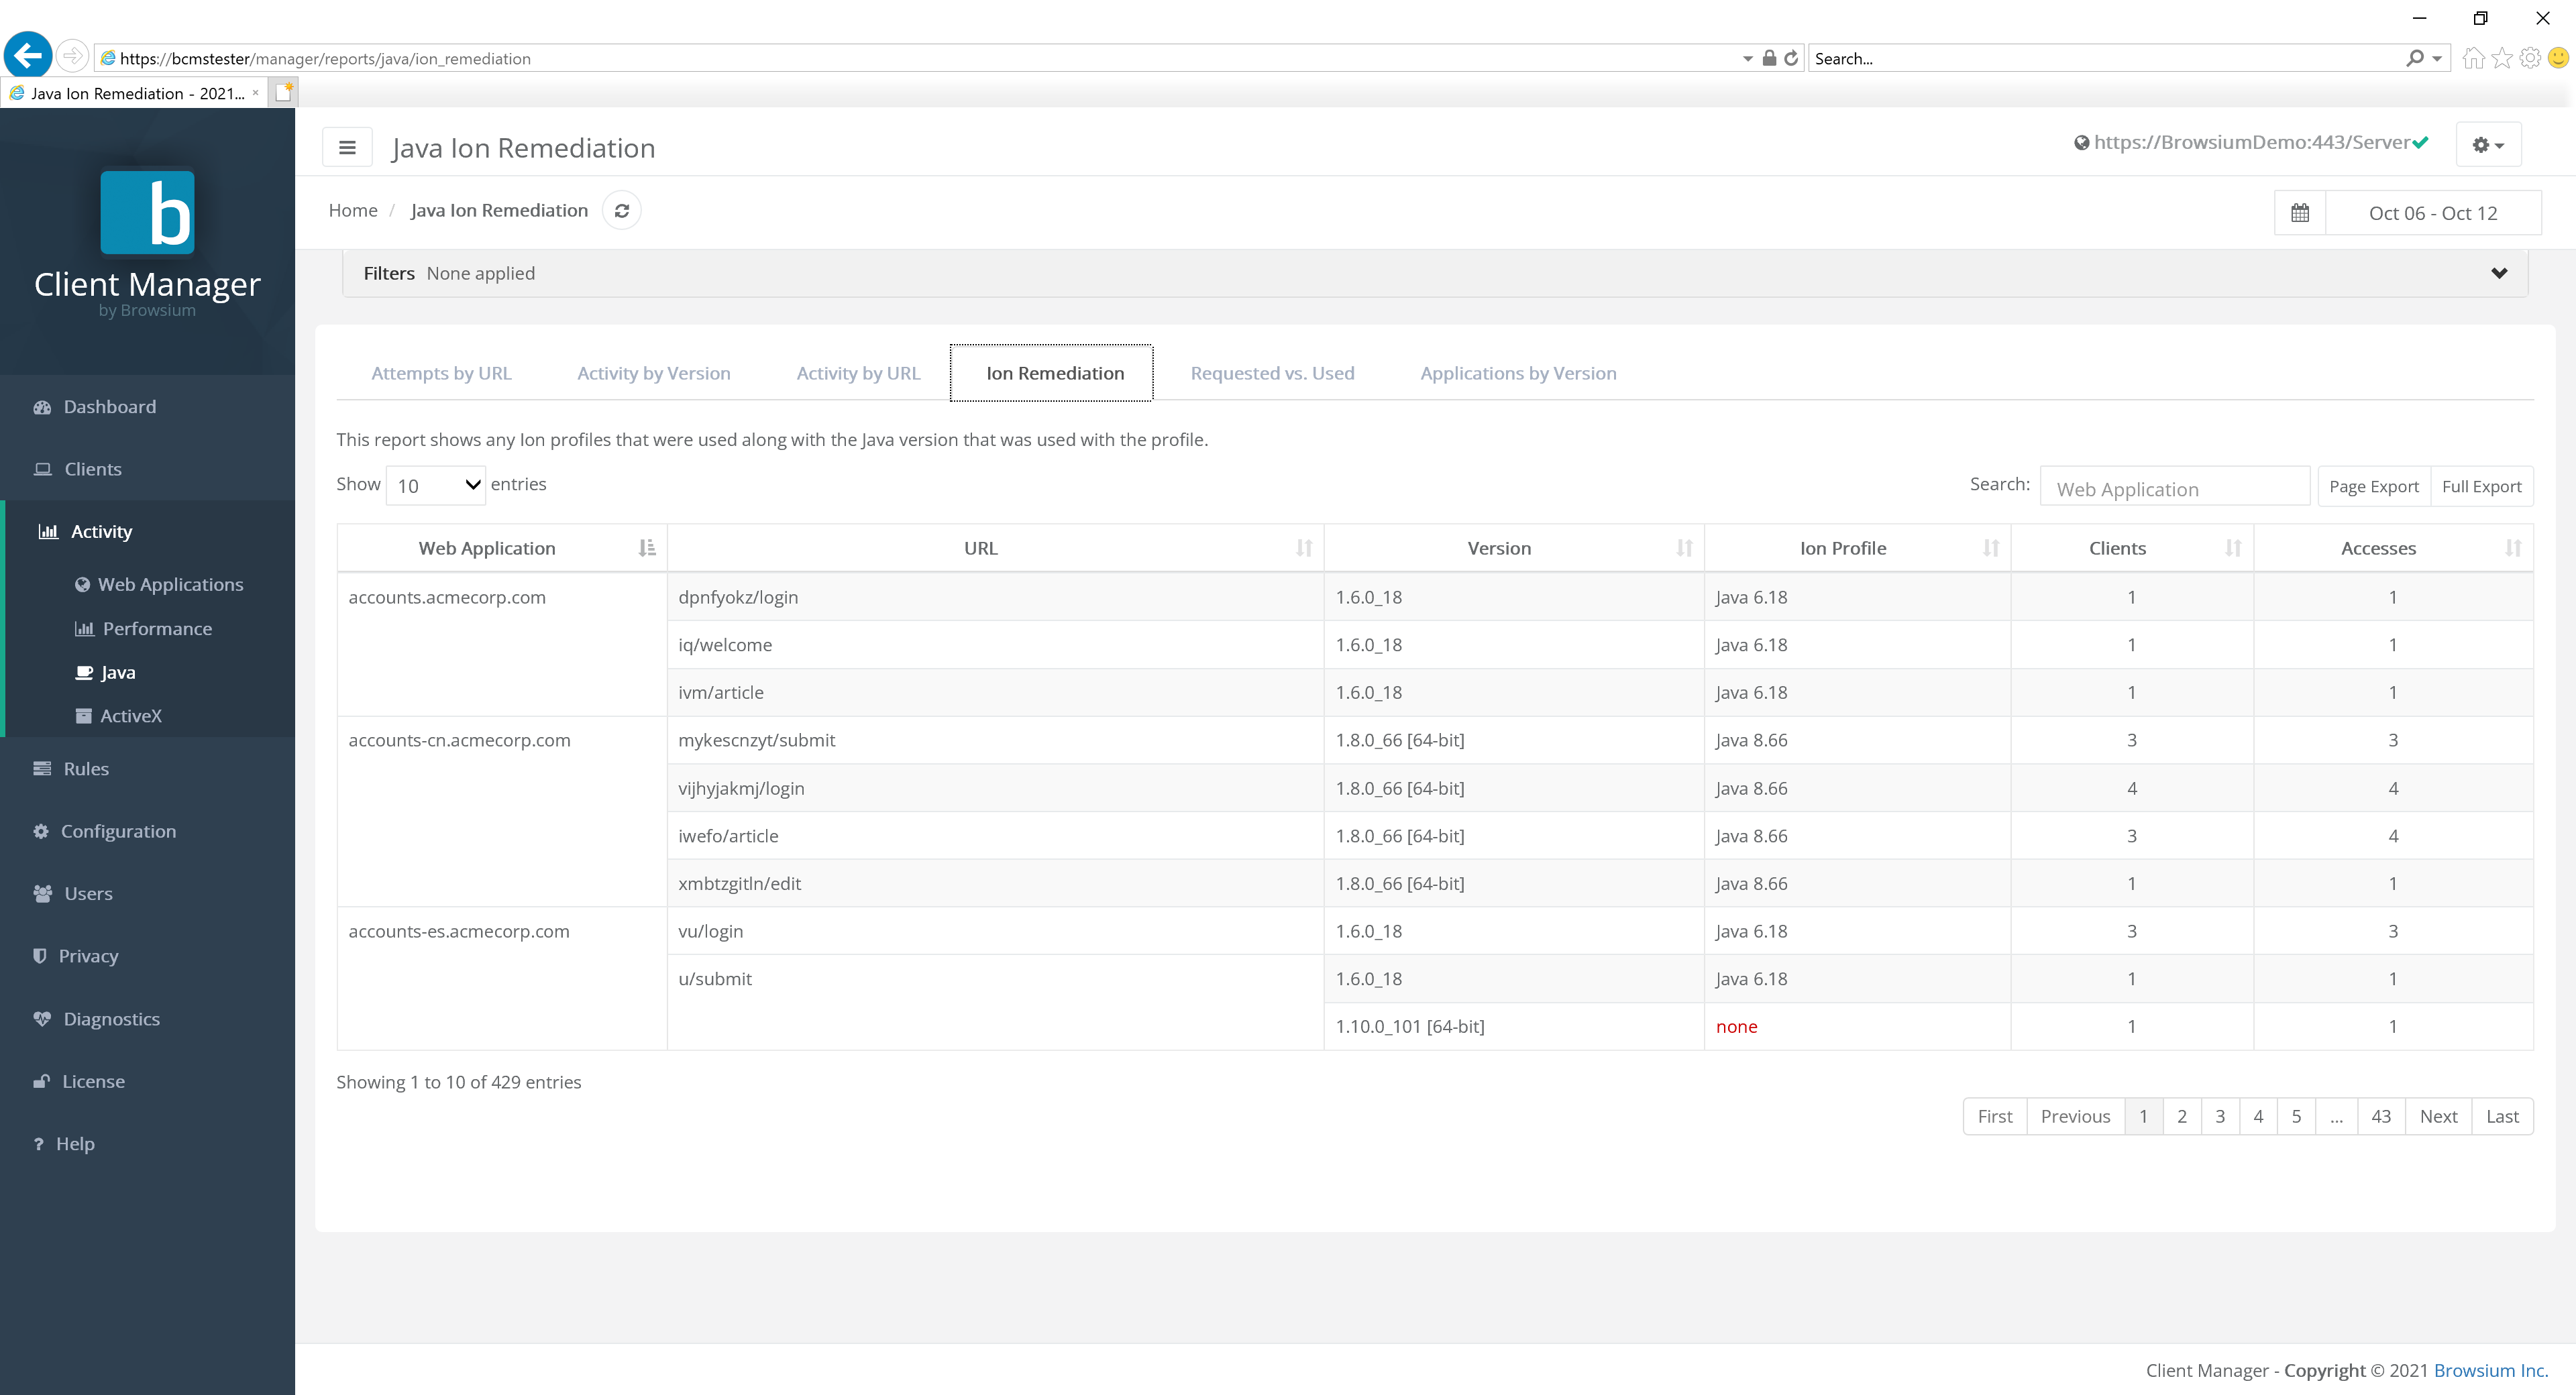 {width=“5.707844488188976in” height=“2.3644794400699913in”}
Browsium customers using Ion for Java management use this report to understand where Ion is used to replace Java versions for specific web applications.
Each row represents a web application as a group of URLs, all of which are broken out within the grouped row.
URL is the specific and detailed list of all URL associated with the specific web application.
Ion Profile indicates the name of the Ion Profile that was used to invoke a specific version of Java. Note that Ion Profile will only be displayed for Full profiles, not Limited Java profiles.
The Version column displays which Java version was used by the specified URL. Clicking this item brings up the Access detail page view for that URL.
Clients indicates the total number of clients that have that version of Java installed. This is useful for answering the question “What’s the most prevalent version of Java installed in my org?”
The Accesses column displays the number of times that URL was accessed.
Java Requested vs. Used
Section titled “Java Requested vs. Used” {width=“5.958113517060368in” height=“2.5639041994750658in”}
Each row represents a web application as a group of URLs, all of which are broken out within the grouped row.
URL is the specific and detailed list of all URL associated with the specific web application.
The Requested column indicates the version of Java requested by that specific web application/URL.
The value in Requested may be listed as ‘Not Specified’, which indicates the web application indicated a generic value for Java rather than a specific version value ID.
The Used column indicates the version of Java actually used by the client for that specific web application/URL.
Clients indicates the total number of clients that have that version of Java installed.
Some Java web applications will request a specific version of Java be used, but if that version is not available, the default version of Java will be run instead. This may explain why the versions of Java requested vs the versions of Java used are different in your organization.
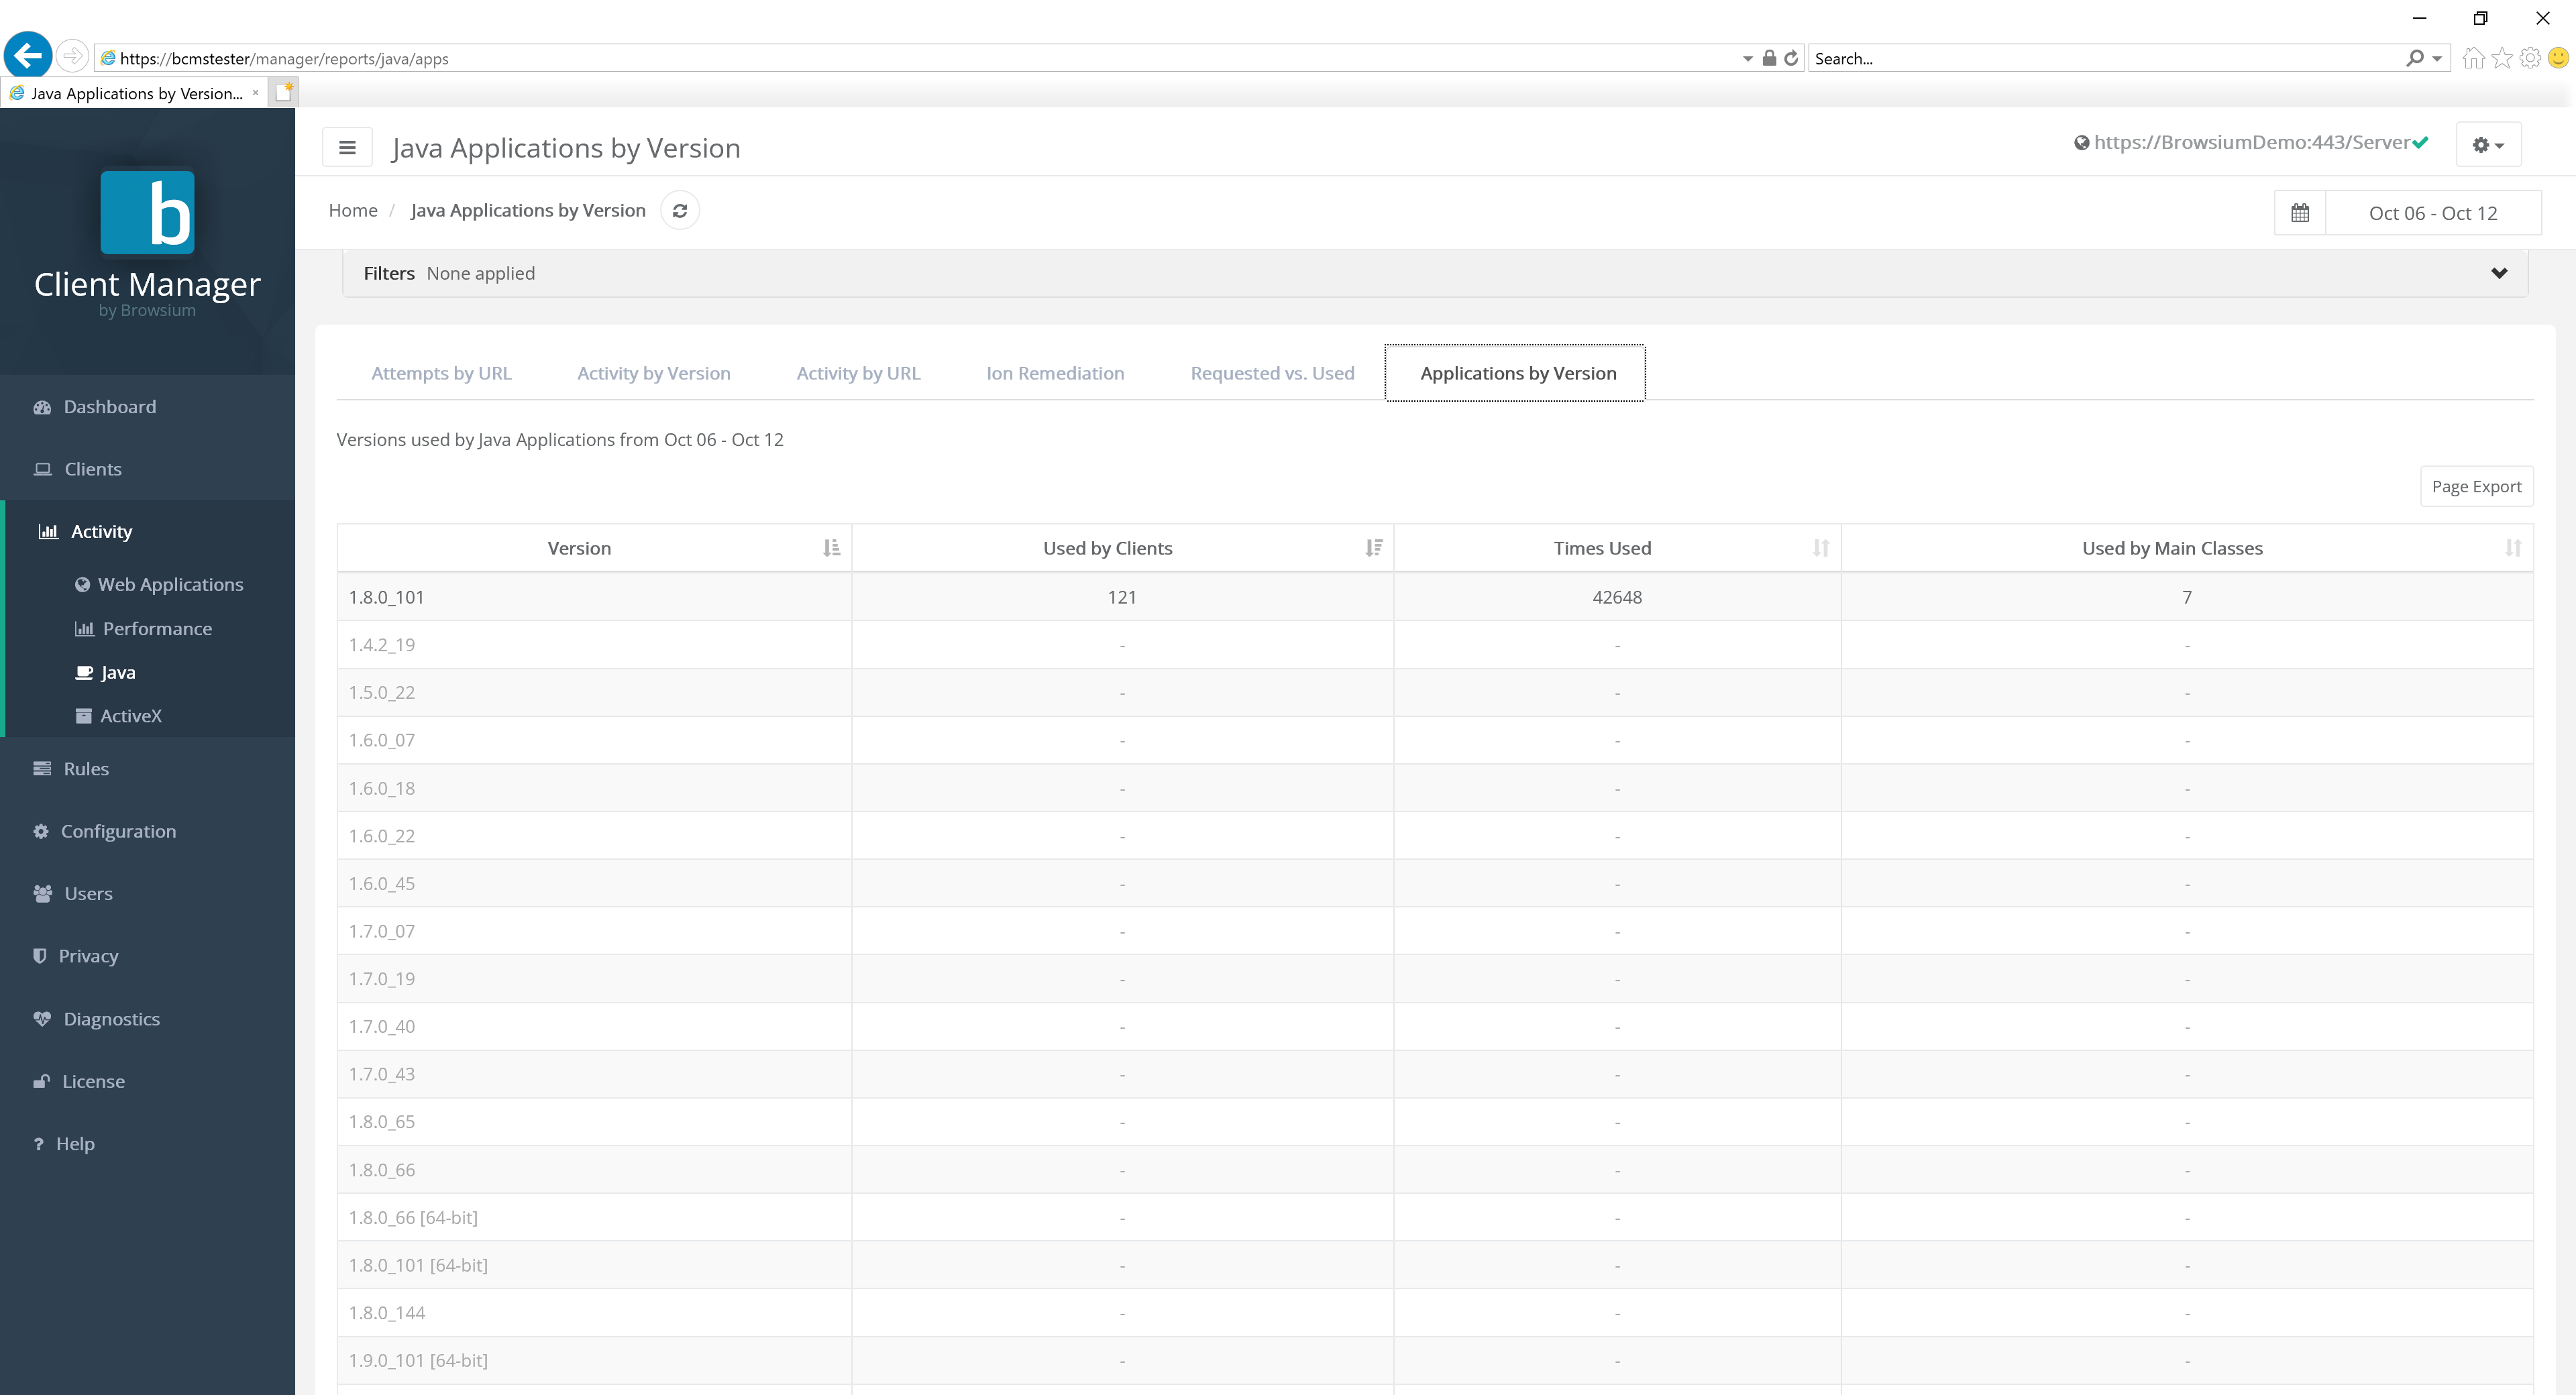
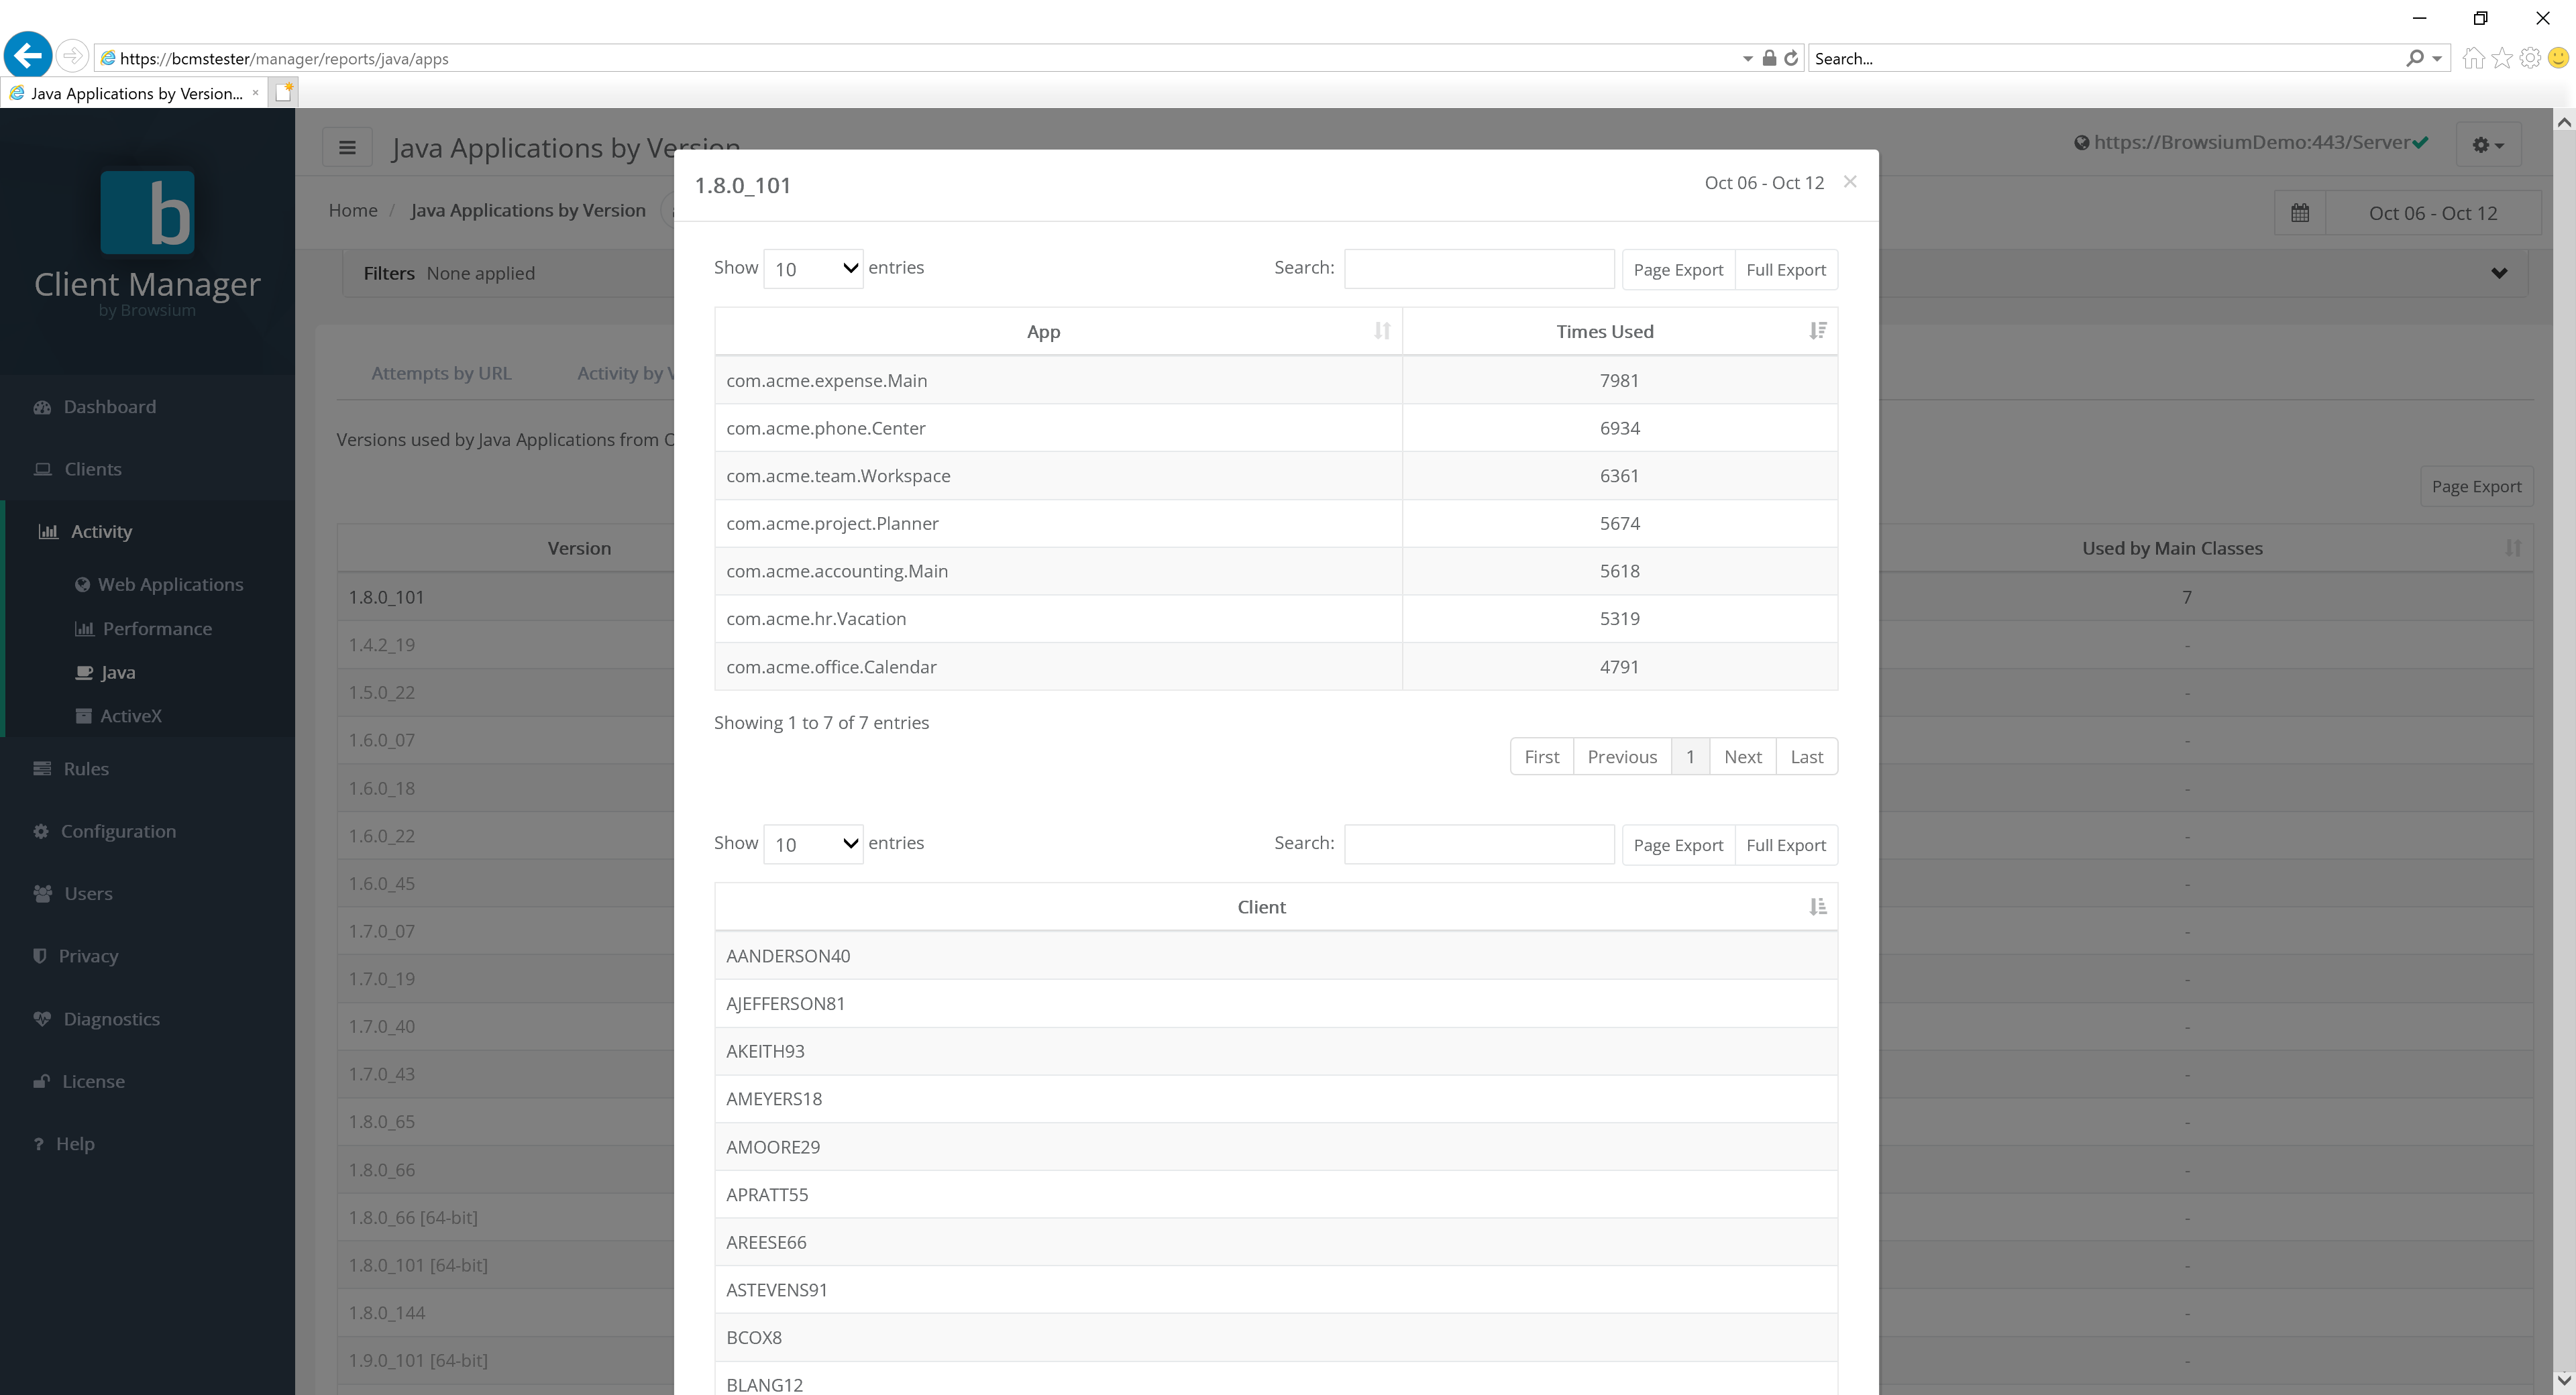
Java Applications by Version
Section titled “Java Applications by Version”Proton can track Java usage instantiated from within the browser but is actually running outside as a standalone application. Some examples of these applications would be applications launched using Java Web Start.
 {width=“5.872794181977253in” height=“2.809479440069991in”}
 {width=“4.54340769903762in” height=“3.6408278652668415in”}
[]{#_Rules_Page .anchor}
ActiveX
Section titled “ActiveX”The ActiveX Usage report provides a view of all discrete ActiveX controls installed on any Proton client systems, including ActiveX control security values. The data can be viewed in several different ways, based on Activity usage.
Attempts by URL
Section titled “Attempts by URL”The default view for ActiveX reporting is the Attempts by URL tab. Another way Proton can help an organization is through audit and compliance validation. The Attempts by URL report provides a navigation level view of which ActiveX controls were requested by a given URL, correlated to that control actually being loaded. This data is essential to ensure validation of internal controls, as well as provide a resource when attempting to investigate when and where a specific control is needed — so the use can be locked down or eliminated. The data in this chart includes:
-
Web application (name if defined, otherwise the TLD)
-
URL (detailed path value)
-
Name of the ActiveX control referenced
-
Specific version of the ActiveX control loaded (or ‘not used’)
-
Number of client systems on which the activity occurred
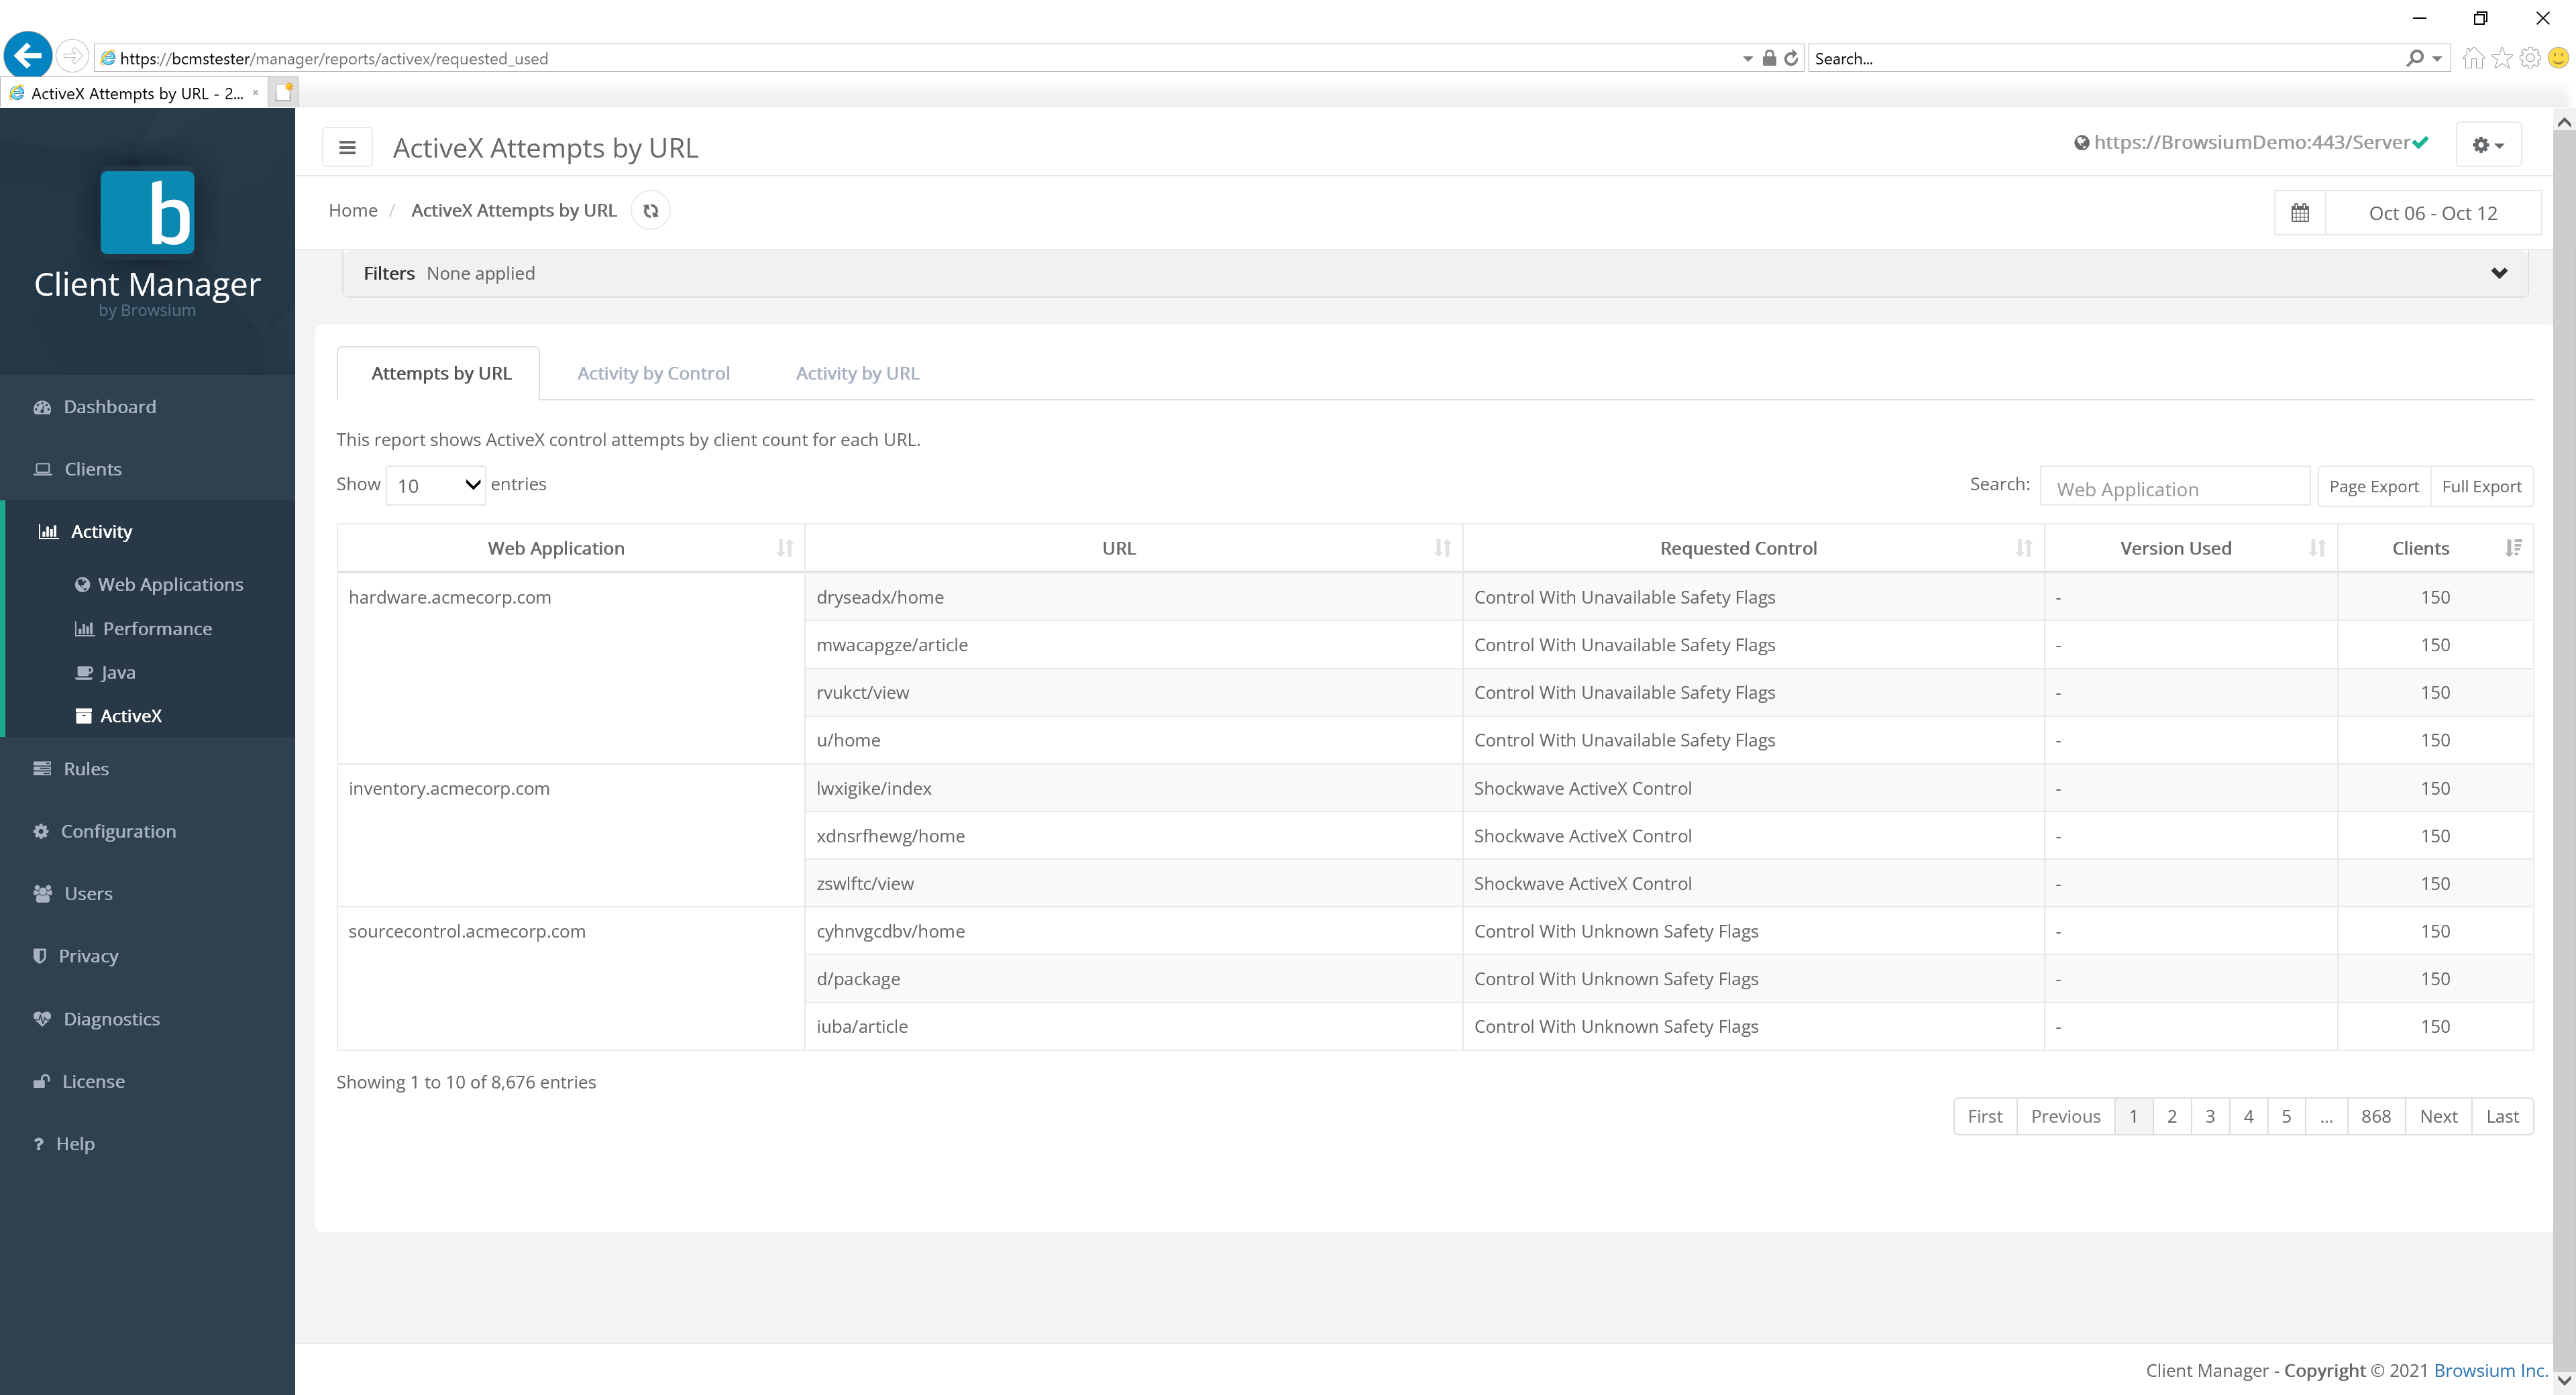 {width=“5.7011023622047245in” height=“2.352455161854768in”}
Clicking the detail in a row brings up the Access view page for the given URL.
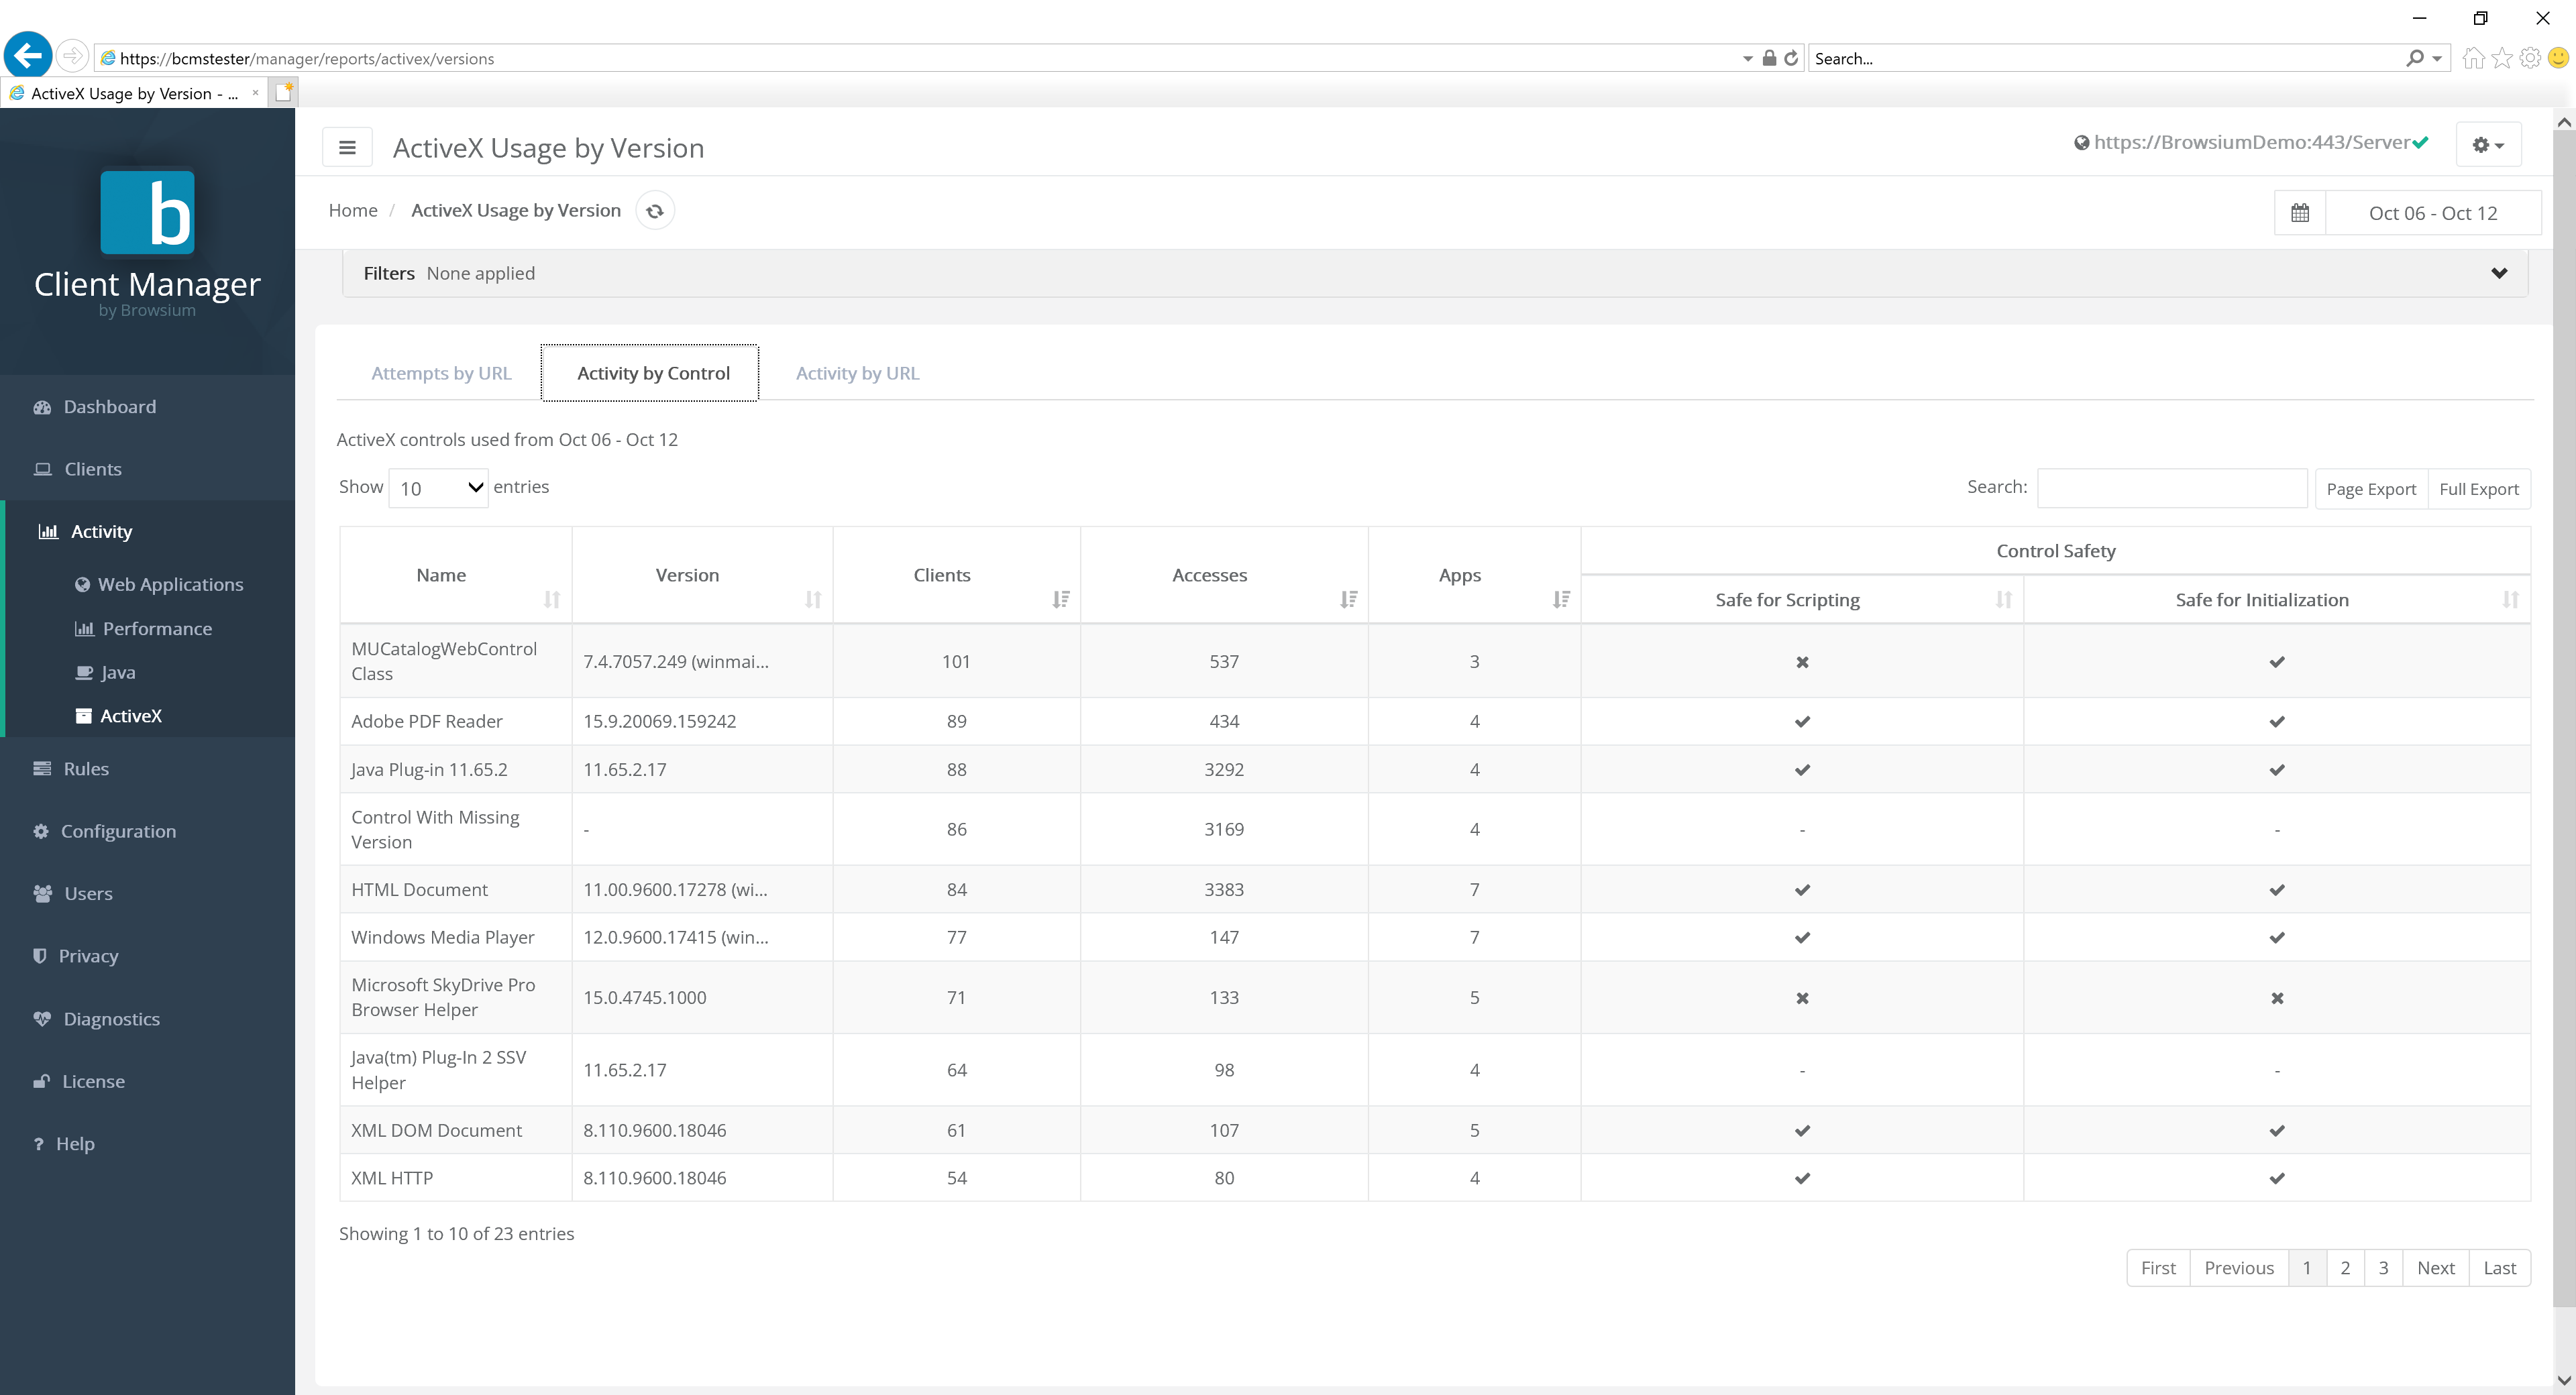
ActiveX Activity by Control
Section titled “ActiveX Activity by Control”This tab view provides a row-by-row listing of each ActiveX control and the following specifics:
-
Detailed version number
-
Number of client systems on which it is installed
-
Number of times that control was accessed by any visited web application
-
Number of unique web applications where the ActiveX control was accessed
-
Security marker values for the given control: Safe for Scripting and Safe for Initialization
 {width=“5.668549868766404in” height=“2.51624343832021in”}
Click any row in the report for more detailed information about that ActiveX control:
{width=“5.890702099737533in” height=“4.343134295713035in”}
A filter at the top of the chart allows users to easily find Java versions as instantiated by zone, browser, machine name or domain user, Client IP, AD Site, or User OU values:
In addition, columns can be sorted in ascending or descending order by clicking on the arrow sort button next to the column label.
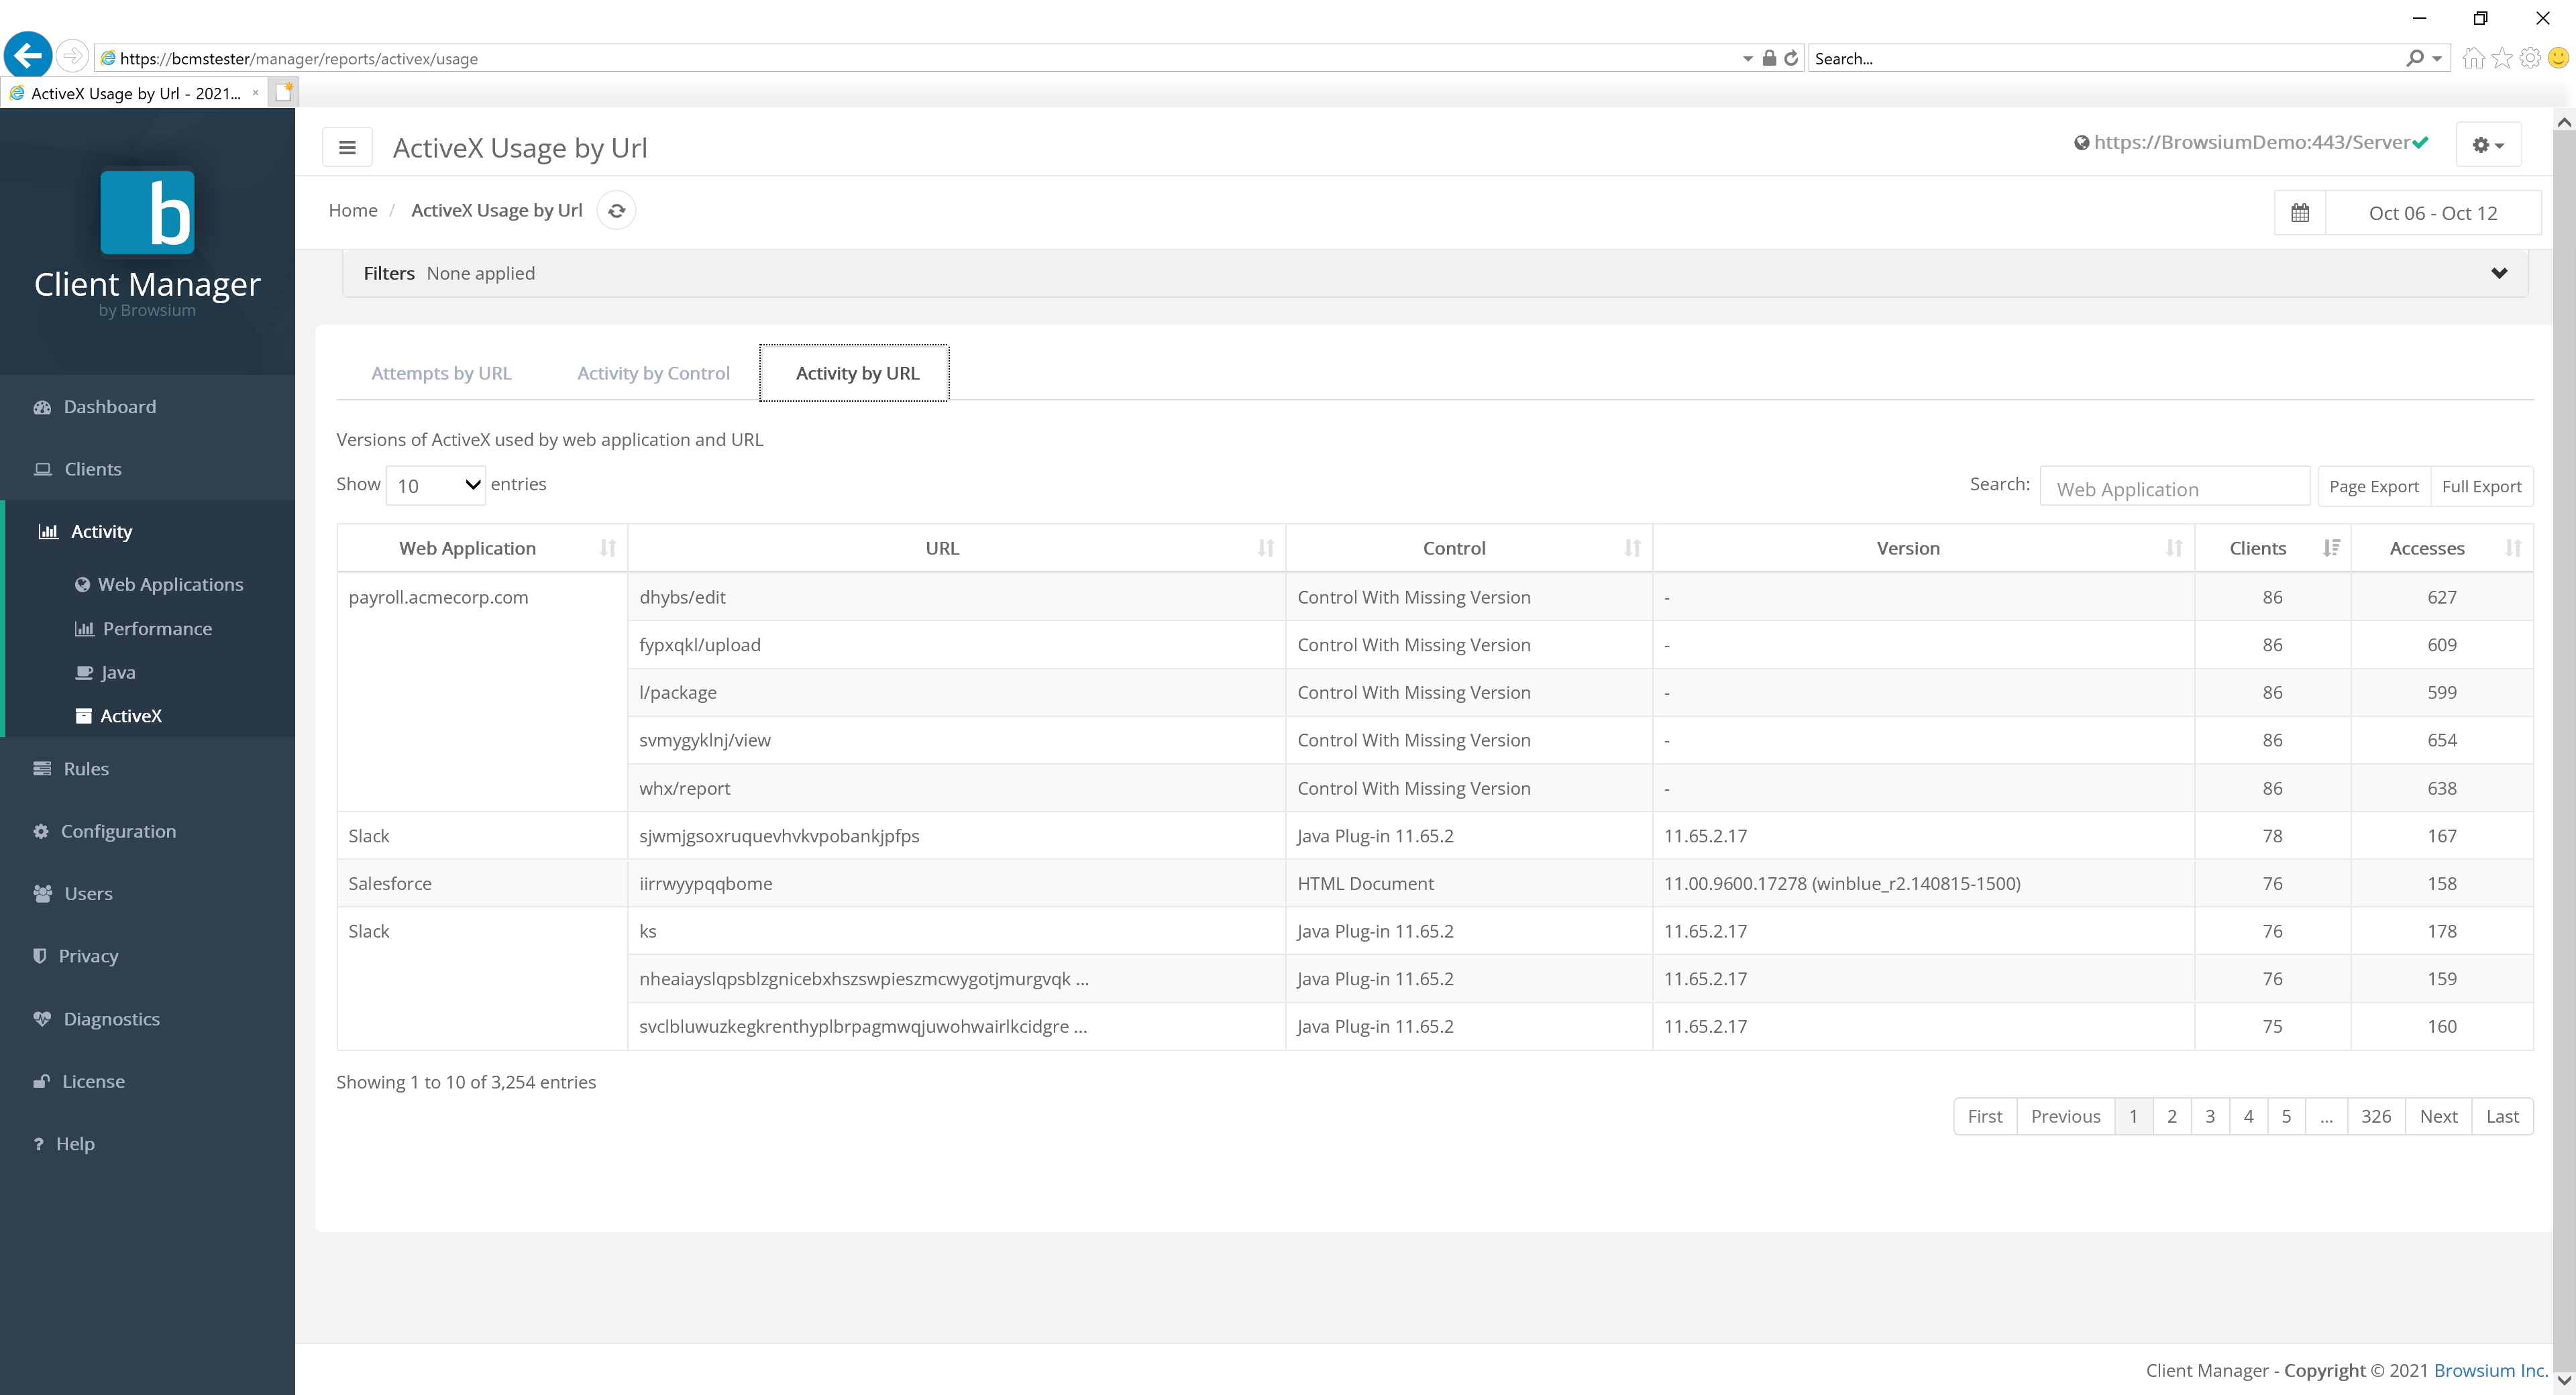
ActiveX Activity by URL
Section titled “ActiveX Activity by URL”This view provides a view of the ActiveX control data by URL, enabling an easy way for administrators and security staff to see what is required (or requested) for a given web application. The items on this view are:
-
Web application (name if defined, otherwise the TLD)
-
URL (detailed path value)
-
Name of the ActiveX control referenced
-
Specific version of the ActiveX control loaded
-
Number of client systems on which the ActiveX control was used
-
Number of accesses for the given URL
 {width=“5.692405949256343in” height=“2.3521675415573053in”}
Clicking the detail in a row brings up the Access view page for the given URL.
Rules Page
Section titled “Rules Page”The rules engine allows Proton administrators to either ignore specific web applications or map a URL to a specific web application. Enabled rules are applied to all Proton clients and are processed and updated on clients each time they report data to the Proton server.
By default, there are no pre-configured or pre-enabled rules in Proton. To add a new rule, select the New Rule button.
Two types of rules supported in Proton: Map and Ignore. Map rules allow Proton administrators to assign URLs to a specific web application. This is useful when a single Web application has multiple URLs and allows the administrator to make them appear as a single web application in the Proton reports. Ignore rules allow Proton administrators to filter out web applications that may be of no interest, for example search or shopping websites.
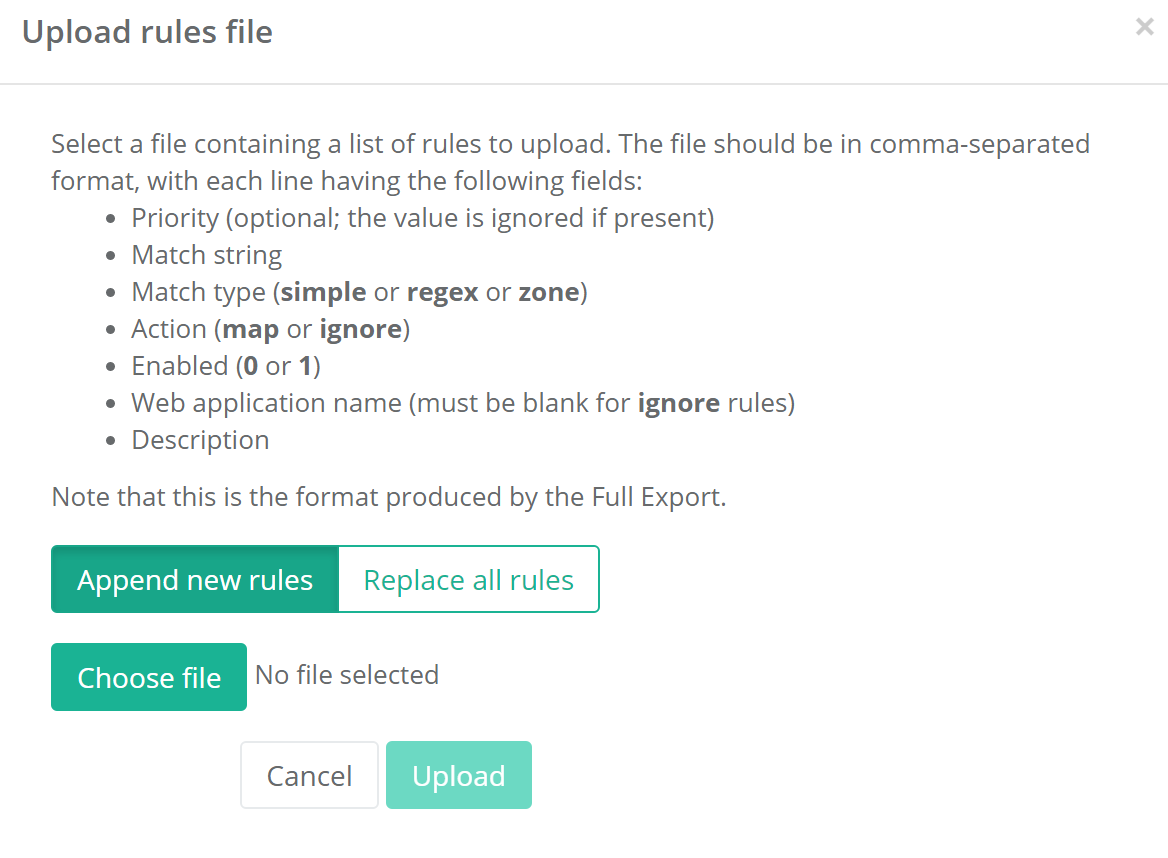
You may want to exclude a range of activity to categories of sites, such as social media or search engines, etc., accessed by Proton clients. Proton enables you to define multiple Map or Ignore rules in one step. To upload a premade or custom set of rules, select the Upload Rules button.
When uploading rules, be sure to select the desired append or replace option. Selecting ‘Append new rules’ will add any rules after all existing rules. ‘Replace all rules’ will overwrite any existing rules, without additional warning.
 {width=“4.574347112860893in” height=“3.3603860454943133in”}
The bulk rules file should be in tab-separated format with each line having the following fields: Match string, Match type (simple, regex or Zone), Action (map or ignore), Enabled (0 or 1), Web application name (blank for ignore rules), and Description (optional). The format of the upload file is the same as the Full Export option available on the Rules page.
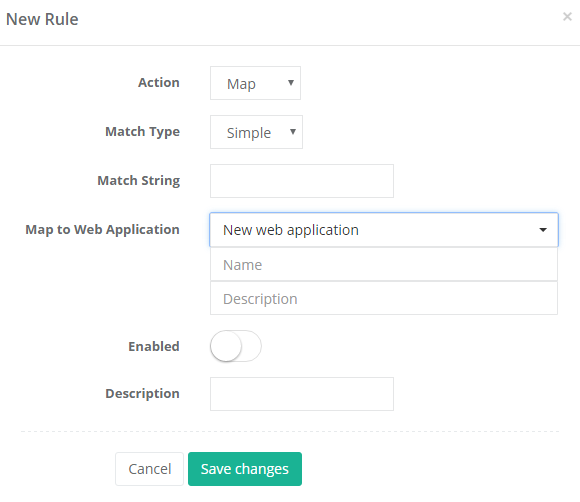
Building a rule
Section titled “Building a rule”The rule builder allows great flexibility in building a rule:
 {width=“3.9070253718285213in” height=“3.3815977690288714in”}
Match Type allows you to select between a “simple” match or a SQLLike match. Simple matches to simple prefix matching, e.g. “www.google.com” will match any URL under “www.google.com” but will not match a subdomain like “maps.google.com.” In SQLLike, a specific character string is matched to a specified pattern. A pattern can include regular characters and wildcard characters. During pattern matching, regular characters must exactly match the characters specified in the character string. However, wildcard characters can be matched with arbitrary fragments of the character string.
Please refer to Microsoft’s documentation of LIKE Operator under T-SQL at https://docs.microsoft.com/en-us/sql/t-sql/language-elements/like-transact-sql
Enter the appropriate URL or URL fragment in the Match String field, e.g., “google.com”.
For Map rules, you are then presented with a list of web applications that have already been reported by Proton clients in the system, or you can enter a new name to represent a new web application. Ignore rules are not associated with existing web applications and this option does not appear for Ignore rules.
A specific rule can be enabled or disabled at any time by flipping the ‘Enabled’ button. The default for a new rule is Disabled, so be sure to enable the rule prior to saving changes.
Finally, enter descriptive text for any new rules (to help administrators identify rules) and select the ‘Save changes’ button.
Once saved, Rules will appear in the view:
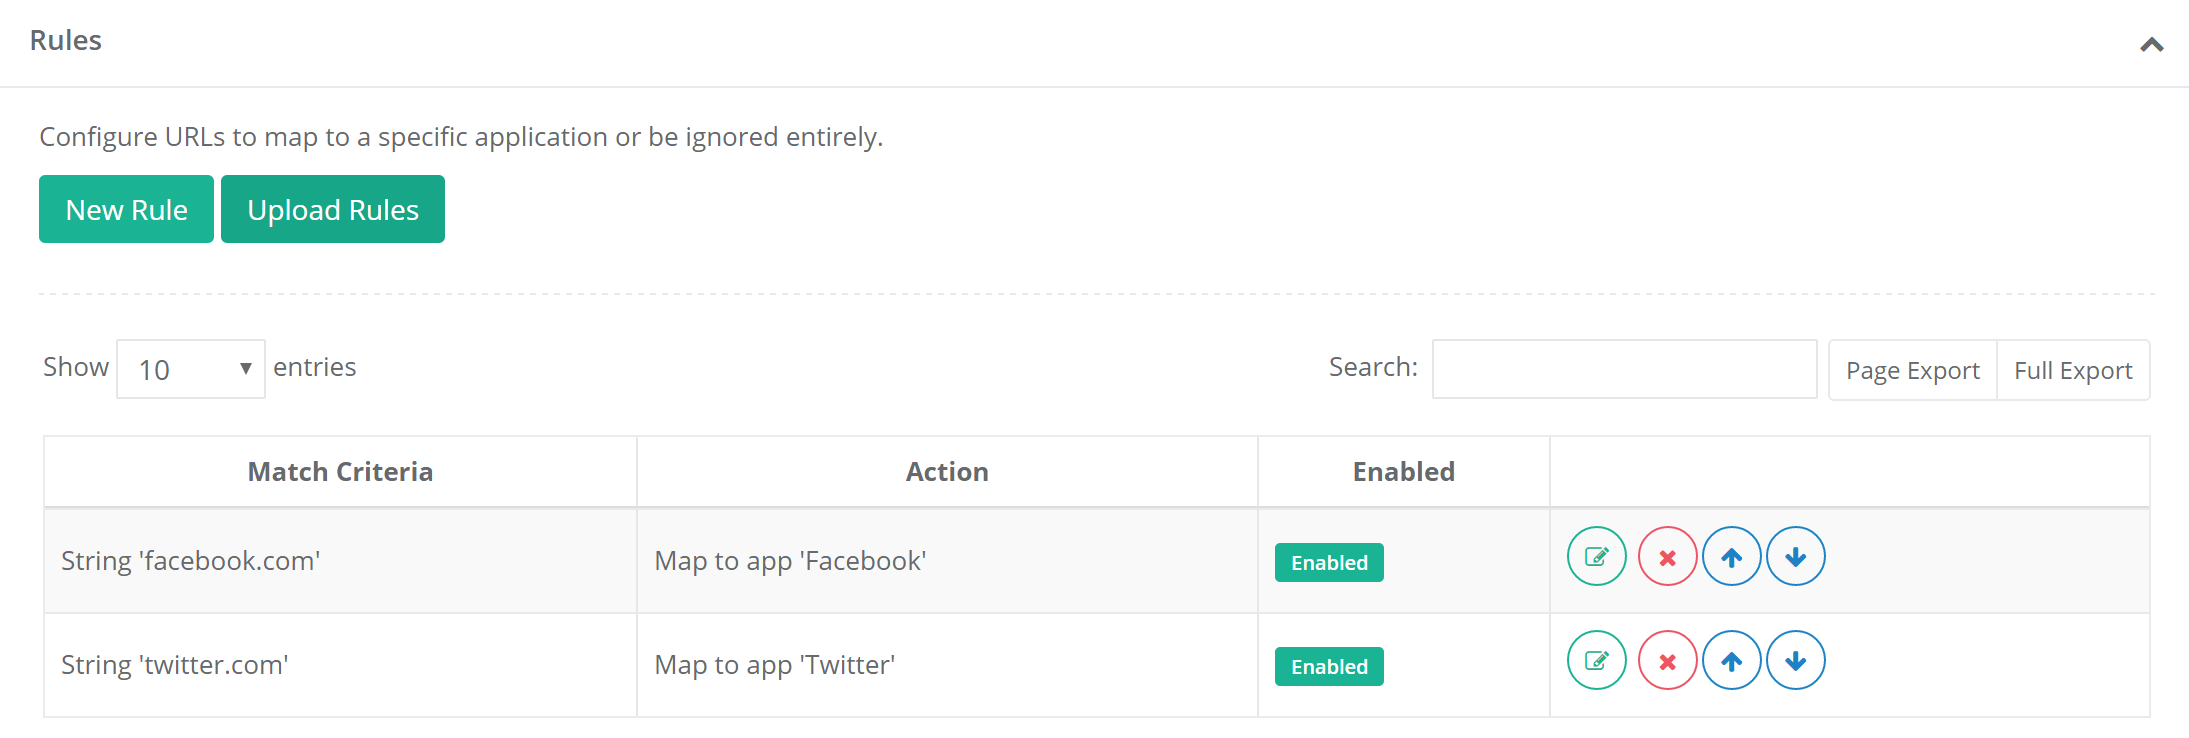 {width=“5.781205161854768in” height=“1.9493044619422573in”}
Editing a rule
Section titled “Editing a rule”Existing rules can be modified by using the four buttons:
 {width=“1.4270833333333333in” height=“0.375in”}
From left to right, these buttons are Edit, Delete, Move up, and Move down.
Edit will allow the administrator to modify the behavior of that particular rule using the same rule building UI used to create the rule.
Delete will permanently delete the rule from the list. For rules that you wish to temporarily remove, it is recommended that you simply disable them (via the Edit button) so they can be easily restored when necessary.
Rules are executed in order that they are listed, from top to bottom. As soon as a rule match is found for a specific web application, that rule takes affect and subsequent rules are ignored. For this reason, you should make sure that the rules are in the correct order; typically, from most specific (at the top) to most general (at the bottom). Use the ‘Move up’ or ‘Move down’ buttons on the rule list to re-order your rules.
Configuration Page
Section titled “Configuration Page”The Configuration page allows Proton administrators and power users (but not standard users) to control client configuration settings (for heartbeat, data push, and inventory), data retention settings, cloud service definition settings, data collection options, and cloud file data collection (uploads and synced files).
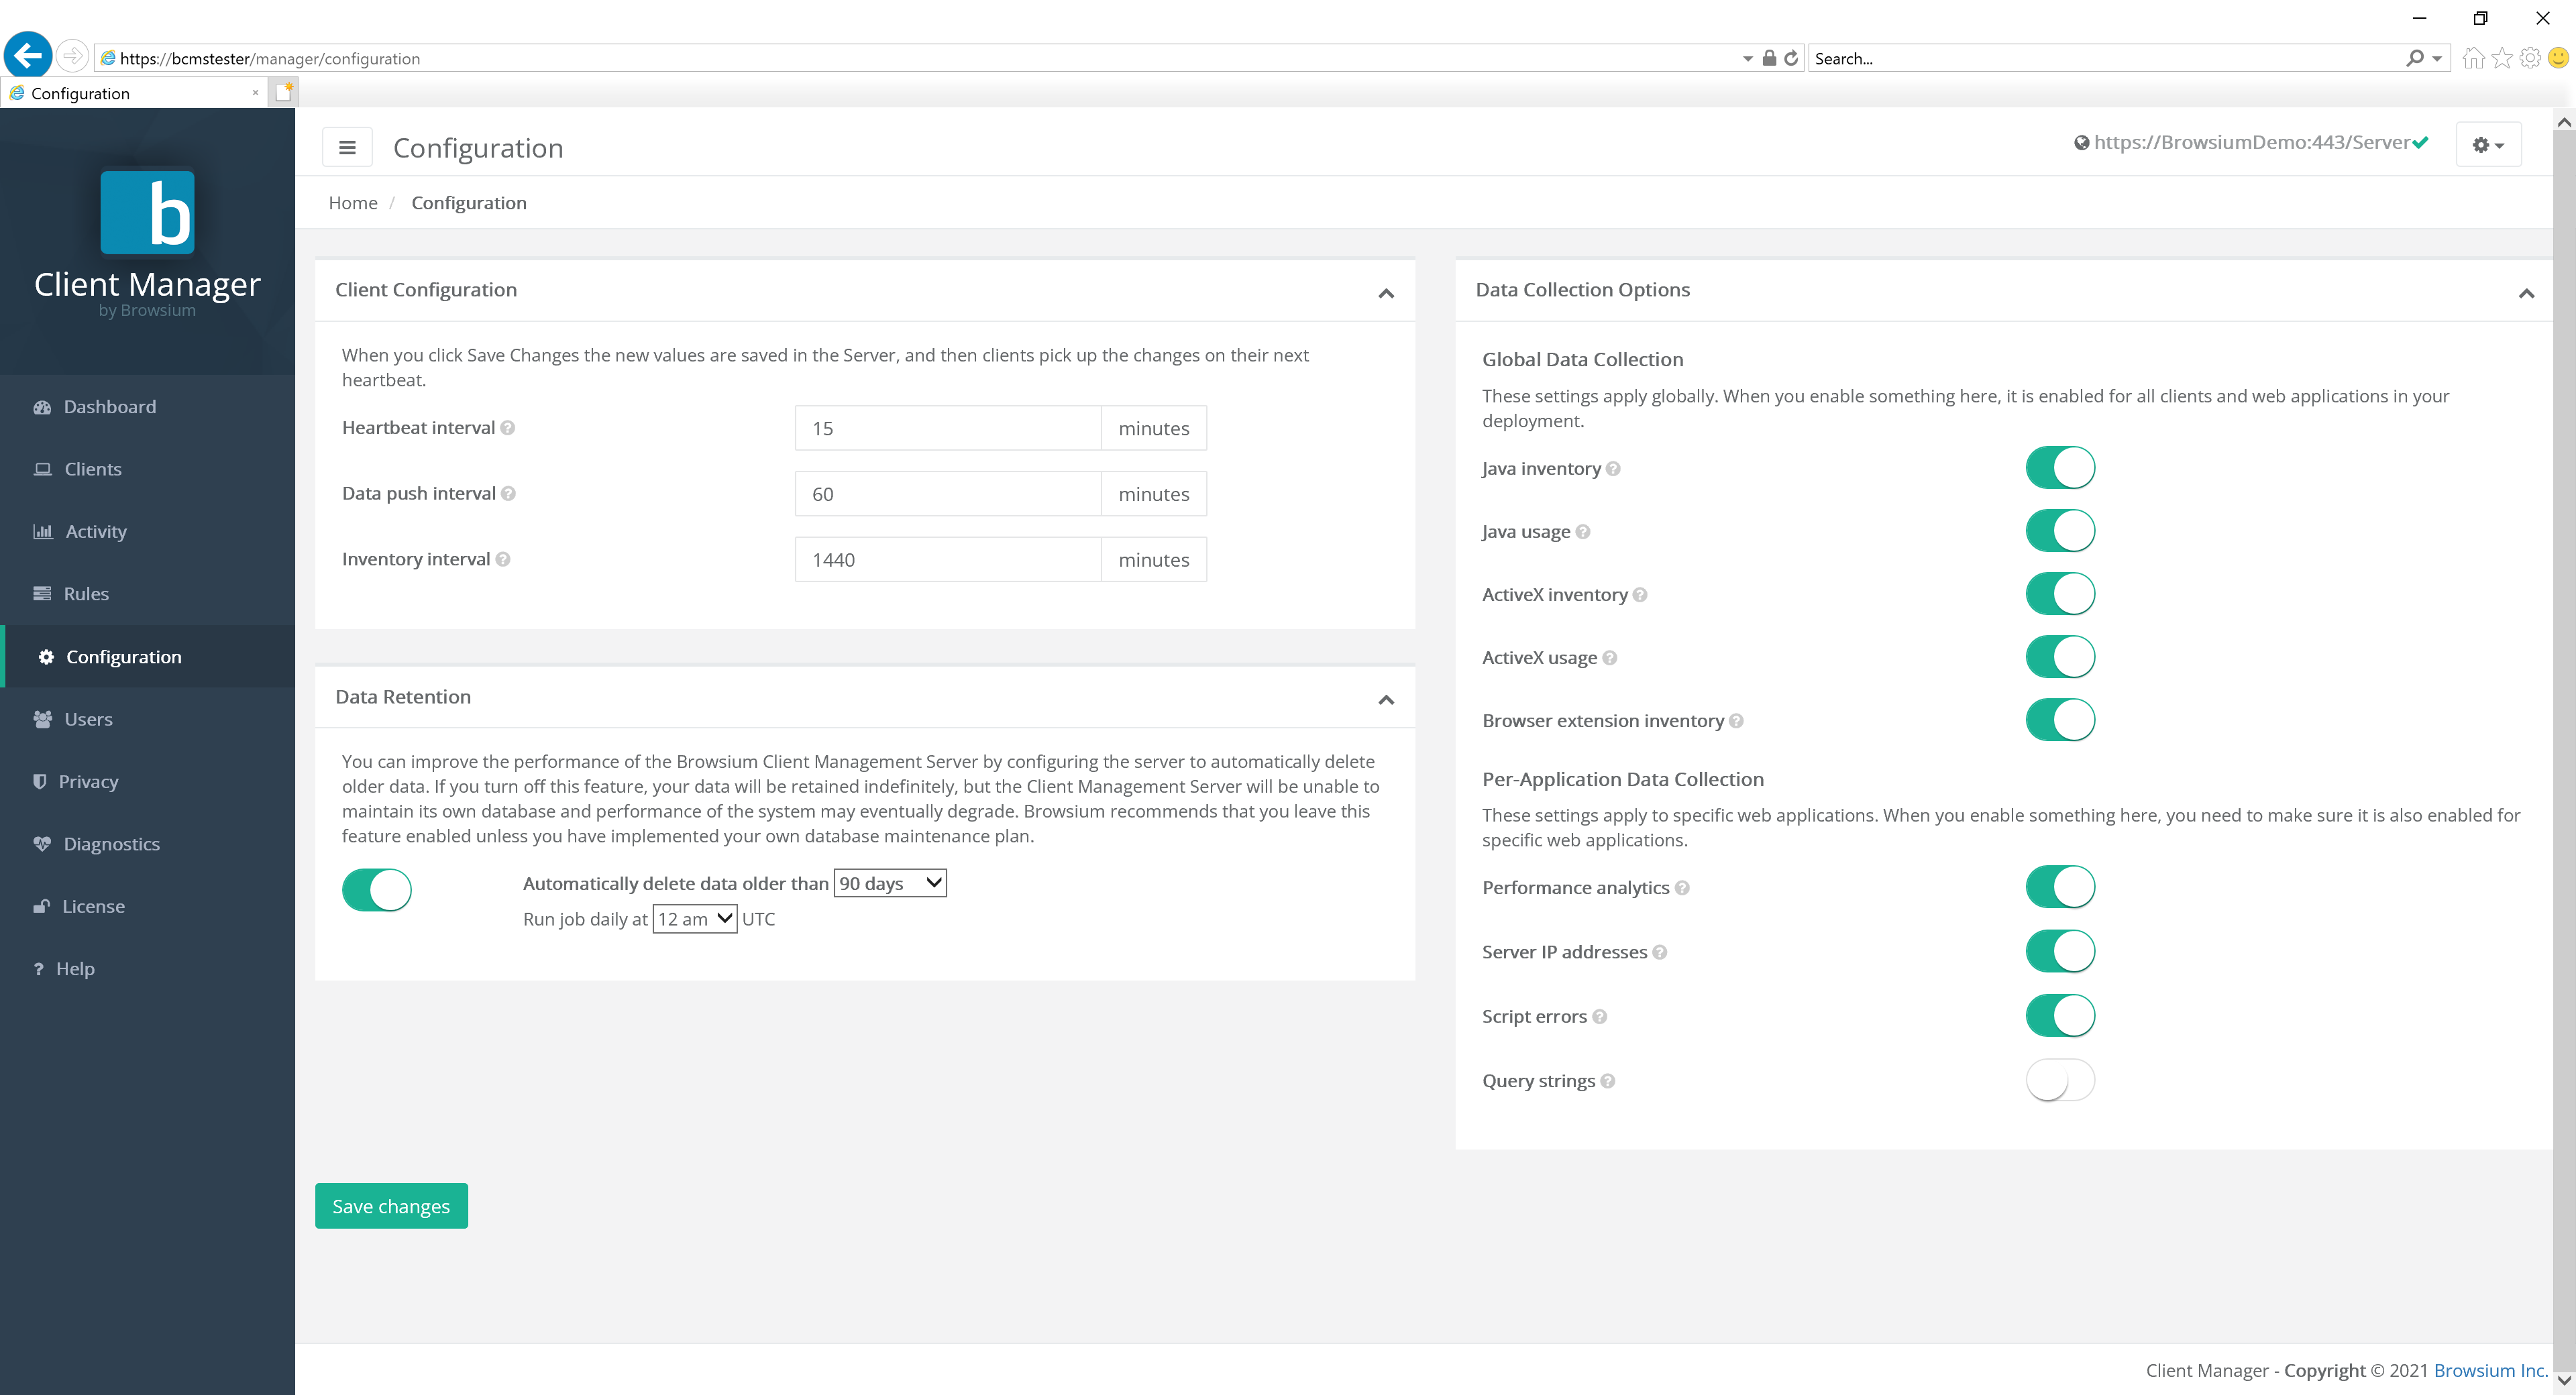 {width=“6.1848687664041995in” height=“2.5035028433945756in”}
Client Configuration
Section titled “Client Configuration”For the Client Configuration options, administrators can specify the frequency in which Proton clients will interact with the Proton server. Standard Proton user accounts will not be able to view or modify the settings on this page.
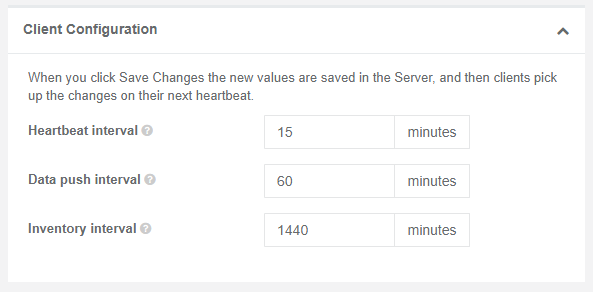 {width=“5.378280839895013in” height=“2.6483267716535432in”}
The available settings for Client Configuration are as follows. BCMS is designed to scale to a large number of client systems, with higher Client Configuration values adding to the server’s scalability.
Value Description Proton Server Default
Heartbeat interval The interval at which clients poll the server (for new settings, rules, etc.) 15 minutes
Data push interval The interval at which clients push data to the server. 60 minutes
Inventory interval The interval at which clients perform an inventory of installed ActiveX controls, Java versions, etc. 1440 minutes
Section titled “Inventory interval The interval at which clients perform an inventory of installed ActiveX controls, Java versions, etc. 1440 minutes”Extension Analyzer Configuration
Section titled “Extension Analyzer Configuration”Proton provides the ability to adjust browser extension risk scoring according to parameters specific and important to your organization. The default values for each category are listed next to each section, and can easily be adjusted at the granular permissions level. In addition, an entire category of permissions risk scoring can be disabled by using the toggle switch next to the section header label.
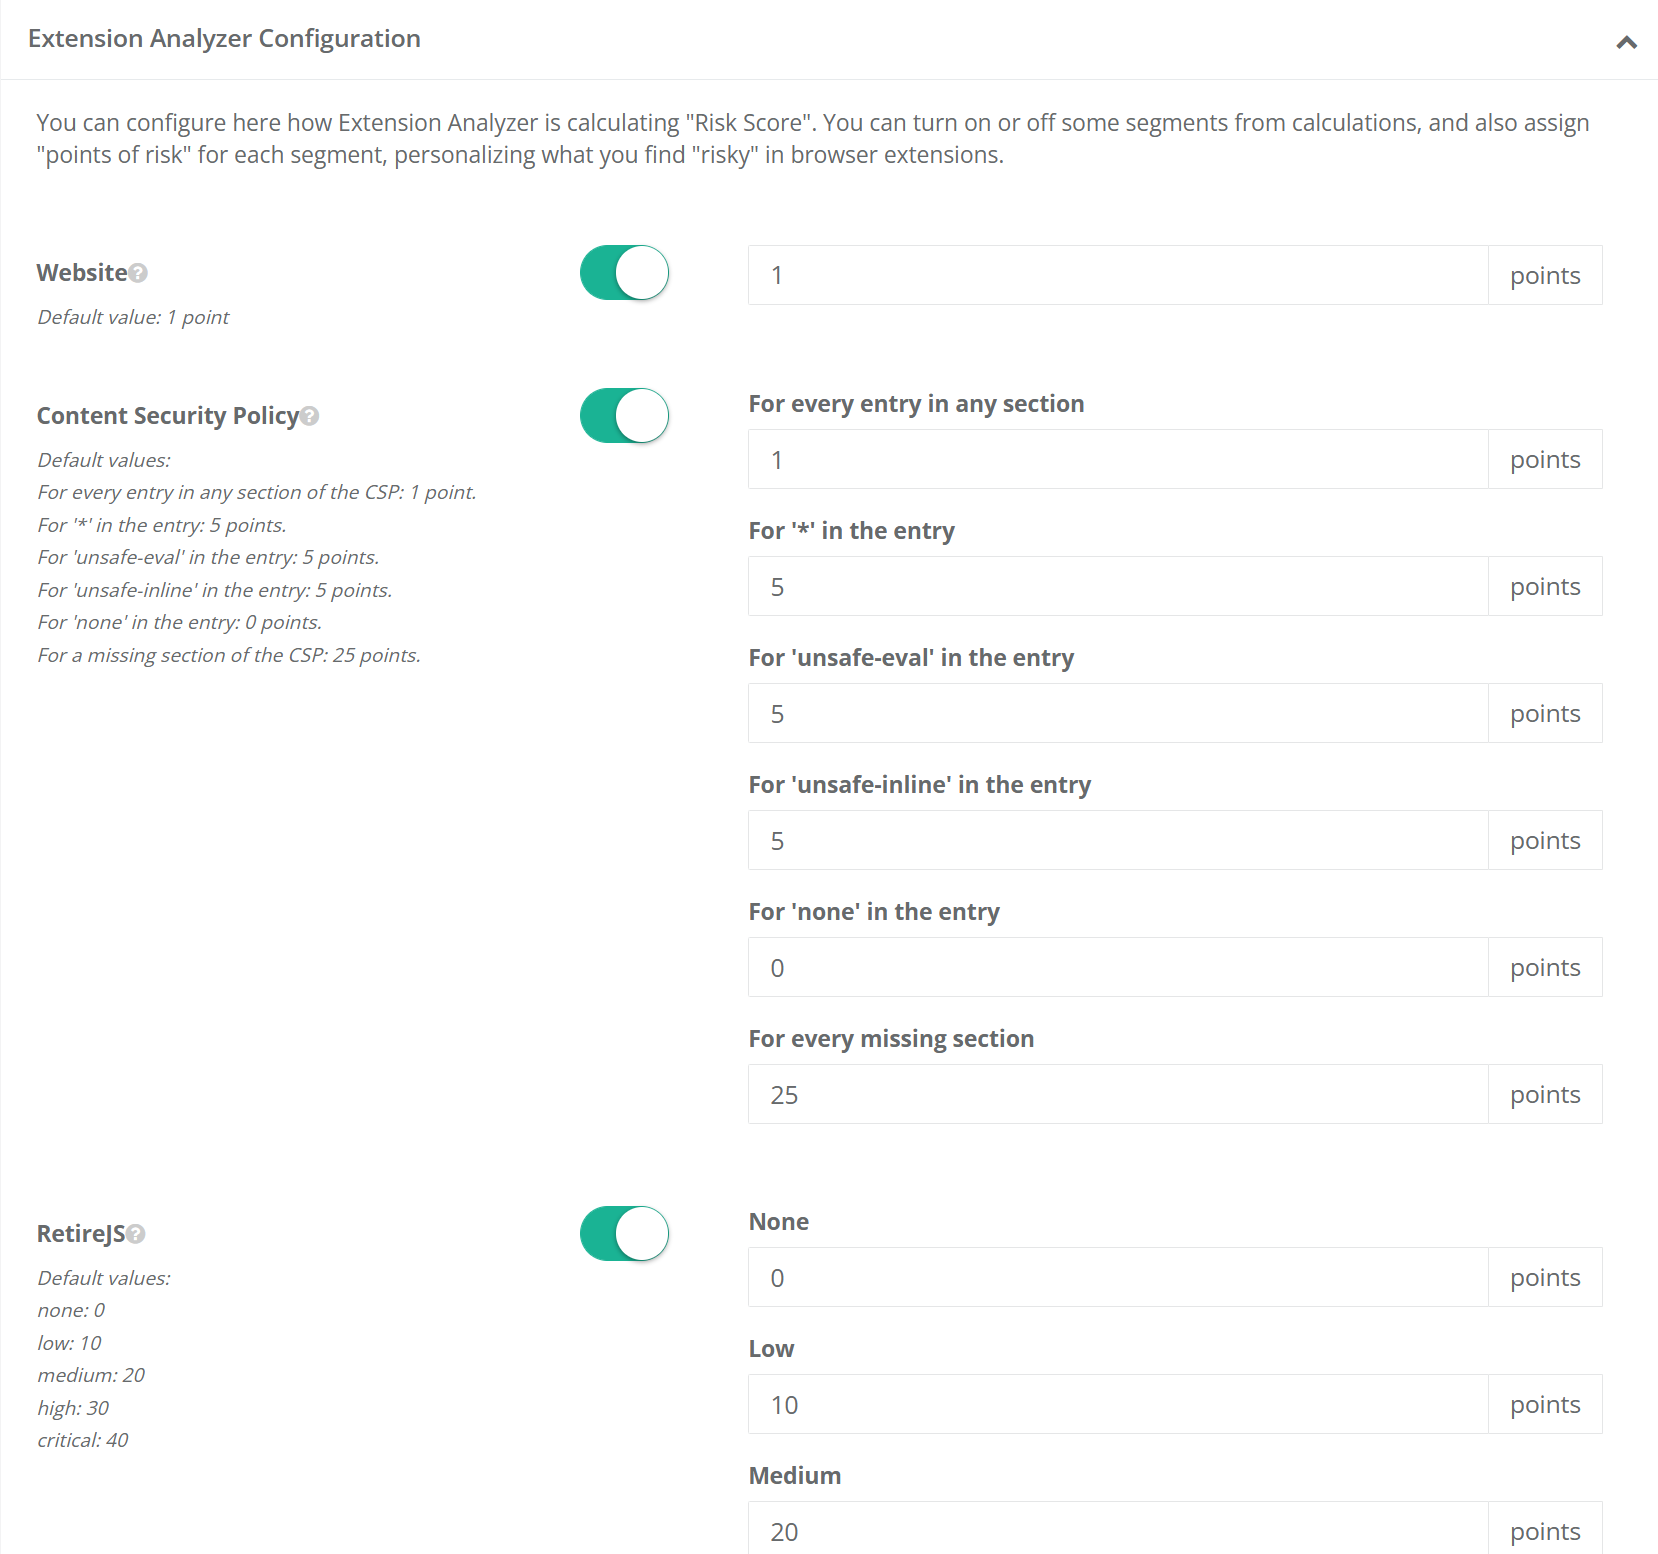 {width=“6.5in” height=“6.092361111111111in”}
The ‘Permissions Breakdown’ configuration section is extensive and long, so users must click the ‘Show More’ button to fully expand it for review and adjustment.
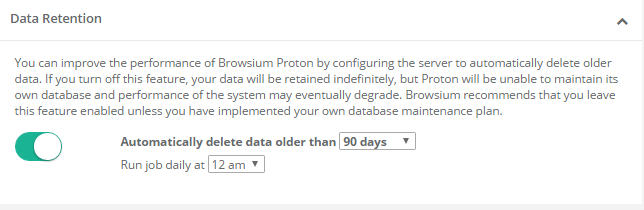
Data Retention
Section titled “Data Retention”BCMS and Proton offer the ability to define data retention policies to support organizational or regulatory compliance requirements, as well as serve to ensure organizations have the ability to limit unbounded growth of the Browsium Proton dataset. The default settings for BCMS are to automatically delete data on a rolling 90-day window, each night at midnight. The values can be adjusted by using the drop-down menu. Alternatively, data retention policies can be entirely disabled by switching the button to the left (off) position.
 {width=“5.231629483814523in” height=“1.7058694225721784in”}
If no data retention policy is defined, the data set will continue to grow, eventually resulting in certain Proton reports taking an extended time to display.
Data Collection Options
Section titled “Data Collection Options”Data Collection Options provide the ability to control what data is collected from client systems. This provides the ability to turn on or off the collection of Java inventory (versions installed), Java usage details, ActiveX inventory (controls and versions installed), ActiveX usage details, Browser extension inventory, page load performance metrics, server IP addresses, and script errors. All options are enabled by default.
{width=“4.091126421697288in” height=“3.3345188101487313in”}
The first five, Java inventory, Java usage, ActiveX inventory, ActiveX usage, and Browser extension inventory, are globally controlled, either on or off for all clients and web applications. The last four, performance analytics, server IP addresses, script errors and Query strings, have a global control with more granular control per web application. When enabled on the Configuration page, performance analytics and server IP address data collection defaults to enabled for each new web application. However, script errors and user accounts work differently.
Query strings are always off by default. This is done in part to conserve space, as query strings can be large as well as often provide little specific value in dataset aggregates. In addition, the default settings help ensure no inadvertent privacy leakage should a poorly designed web application contain PII in the query string.
When enabled on the Configuration Page, the per-web-application script errors setting will default to disabled and must be manually enabled for each web application. This is done to minimize extraneous and potentially private user data. In the case of script errors, many web applications generate harmless script errors in various browsers, so this feature should be turned on only for web applications where you’re investigating specific error conditions reported by users or testers.
[]{#_Users_Page .anchor}
Users Page
Section titled “Users Page”The Users page allows BCMS and Proton administrators to view and control the list of approved Proton user accounts. Proton User and Power User account types are not able to view this page. See section 3.1.1 for details on the pages each account type has access to. User account requests are made by end users at Manager login screen — see section 4.1.3. Pending requests can be approved by clicking on the pending account name and then selecting the Approve button. Accounts can be promoted to administrator or power user status (or demoted to user status) by clicking on the account name and selecting User, Power User or Administrator.
Some user accounts may be marked as ‘service’ accounts. Service accounts cannot be deleted and will prevent accidental removal of accounts necessary to ensure administrative access.
User accounts marked as ‘external’ denote the account is authenticated by Single Sign On.
After the initial installation of BCMS, the first account created is automatically promoted to administrator status. Select a user account to modify it.
{width=“6.060430883639545in” height=“1.6331496062992126in”}
Customers with specific support and management agreements will see accounts marked as ‘Browsium Service Account’. These accounts cannot be deleted by customers. Browsium Service Accounts can only be created and designated by Browsium and is not necessary for all customers. There is nothing wrong if the installation has no Browsium Service Accounts.
{width=“5.71875in” height=“1.0625in”}
Select Edit to change the user account type.
{width=“2.1502930883639544in” height=“2.094682852143482in”}[]{#_Configuring_Password_Restrictions .anchor}
Password Policy Management
Section titled “Password Policy Management”Proton has a range of user account password policy management features, some configured by default (which can be modified) and others that are off by default but can be enabled by a Proton administrator. Password policies can only be configured in the Web.config file on the Proton server, not in Proton Manager. More on how to locate and edit the Web.config later in this section.
Proton provides password and login policies for the following attributes:
Session Timeout — sets the number of minutes until an idle session of Proton Manager ends and displays the logon screen. The Web.config attribute is timeout, located in the system.web/authentication/forms section. The default value is 2880 minutes (2 days).
Minimum Required Password Length — sets the minimum length of the password The Web.config attribute is minRequiredPasswordLength and the default value is 8 characters.
Minimum Required Non Alpha Numeric Characters — sets the minimum number of special characters that the password must have. The Web.config attribute is minRequiredNonalphanumericCharacters and the default value is 1 character.
Maximum Invalid Password Attempts — sets the maximum number of invalid password entries before the user’s account is locked out. The Web.config attribute is maxInvalidPasswordAttempts and the default value is 1000000 (virtually unlimited).
Password Attempt Window — sets the number of minutes to keep track of invalid password attempts. After the window has expired, the number of invalid password attempts is reset. The Web.config attribute is passwordAttemptWindow and the default value is 1.
Password Expiration — sets the number of days until a new password expires, forcing the user to change the password before logging on. The Web.config attribute is PasswordExpiration and there is no default value for this attribute.
Password Strength Regular Expression — sets a regular expression that every password must match. This can be used to set custom password policies. The Web.config attribute is passwordStrengthRegularExpression and there is no default value for this attribute.
You’ll find a series of regular express examples in the Web.config file. An example using many of the above attributes is:
minRequiredPasswordLength=“12” minRequiredNonalphanumericCharacters=“1” passwordStrengthRegularExpression=”(?=(.*[A-Z]){1,})(?=(.*\d){1,})”
The preceding example sets a password policy requiring that all passwords be at least 12 characters long and contain at least one upper-case letter, at least one digit, and at least one special character.
When the passwordStrengthRegularExpression attribute is used, you should set an InsecurePasswordMessage in the appSettings element in Web.config so that your users will know what the password requirements are. The default InsecurePasswordMessage is
”The password must be at least <minRequiredPasswordLength> characters long and contain at least <minRequiredNonalphanumericCharacters> special character(s).”
To locate the Web.config file on your Proton server, navigate to
C:\Program Files (x86)\Browsium\Proton\Server\Sites\Server (or C:\Program Files\ … if you’re using a 32-bit Windows server). You’ll find Web.config in this directory. It can be edited with any text editor, including Notepad. Familiarize yourself with the various sections of Web.config as the entries to control the password configuration outlined earlier in this section are found in various places inside the file.
Once you’ve made your edits to Web.config, save the file. IIS will automatically restart with the web service to immediately apply your new configuration.
When Proton is deployed across a farm of load-balanced web servers, the same changes must be made to Web.config on each server to ensure the password policies are enforced consistently. To simplify this process, change Web.config on one server and copy the file to the other servers in your server farm. Note: This guidance assumes all web servers are communicating with a single Proton database.
Web.config is replaced when upgrading to a new version of BCMS. You’ll need to save a copy of your Web.config file (or keep a separate document with the edits you have made) before upgrading and apply your custom settings to the new file. You should not assume that the old Web.config file will work on the new version of Proton as other aspects of Web.config may have changed to support new features in Proton.
[]{#_Privacy_Page .anchor}
Privacy Page
Section titled “Privacy Page”BCMS and Proton include a Privacy mode to comply with certain international regulations on tracking specific activity to specific users. When Privacy is enabled, all information that can be used to trace user activity back to an individual will be removed. All personally identifiable information from all client user accounts that meet any of the criteria established in the Privacy settings will be removed.
Once personally identifiable information is removed, it cannot be restored. To ensure regulatory compliance there is no mechanism to uniquely identify the user for which activity or data is associated. A unique ID is created to ensure records can be uniquely attributed but that ID has no association to a user and cannot be reverse engineered to identify the specific user.
Privacy is disabled by default.
{width=“5.542215660542432in” height=“1.1510761154855642in”}
To enable Privacy for all client user accounts, select the ‘Privacy enabled for all users’ button. Then select the scope — either ‘Anonymize users’ to only anonymize usernames and IP addresses, or ‘Anonymize users and machines’ to also anonymize machine names. Then Save Changes to commit the Privacy setting. This will anonymize all client user accounts, IP addresses, and (optionally) machine names for all activity from this point forward. It will not retroactively anonymize any prior activity. If you’ve already collected activity data, it will remain in the database and be visible on reports until that data is purged by the data retention policy settings.
{width=“5.821130796150481in” height=“2.368876859142607in”}
Anonymized activity data will be evident in three fields: User, IP Address, and (optionally) Machine. In the example below, the user who accessed www.msn.com has been anonymized to Anonymous155. (The next anonymized user seen by this Proton server will be Anonymous156.) The IP Address has also been anonymized, zeroing out the last octet. Machine anonymization is not enabled in this example.
{width=“4.456827427821523in” height=“1.7341622922134734in”}
Maintaining unique anonymized user and machine names is key to Proton’s ability to track access counts and other data for each web application used by your organization. While the activity can’t be tracked to an individual user, a unique ID is created to enabled correlation with other data to ensure the organization can make informed decisions when managing the web browser and web application environment.
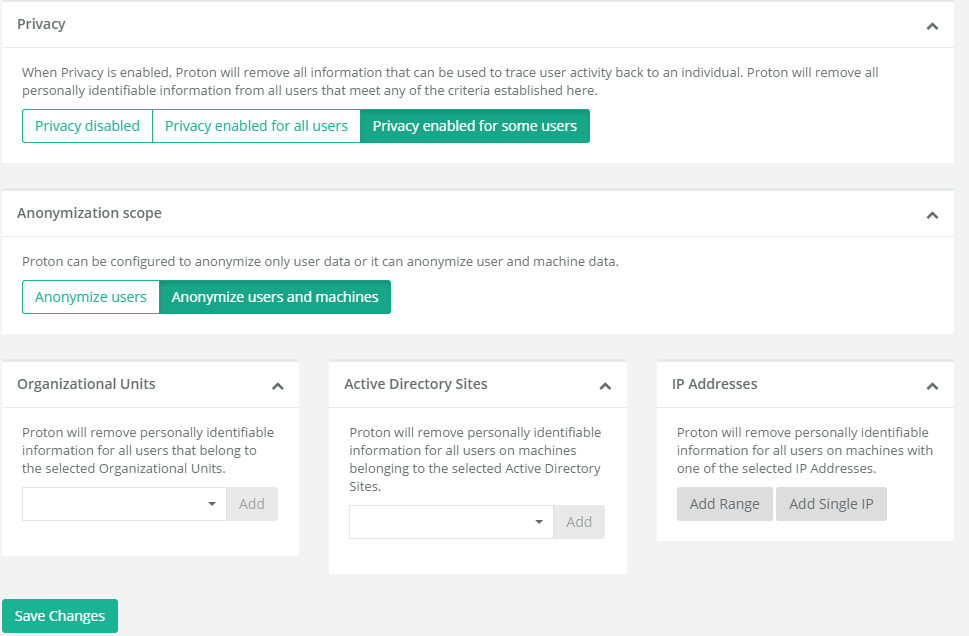
To enable more granular control over which client user accounts are anonymized on your Proton server, select the ‘Privacy enabled for some users’ button. This expands the controls available on the privacy page.
 {width=“5.7858081802274715in” height=“3.7972462817147856in”}
It is possible to limit the privacy settings by Organizational Unit, Active Directory Sites, or IP Address ranges. You can read from existing data to add OU or AD Sites filtering, or add new entries based on your knowledge of your Active Directory structure.
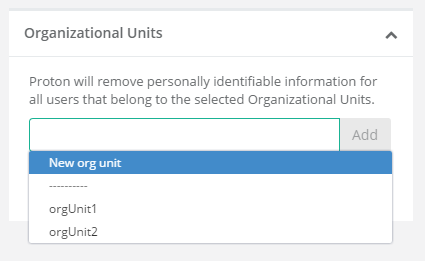 {width=“2.6362445319335084in” height=“1.6189643482064742in”}
 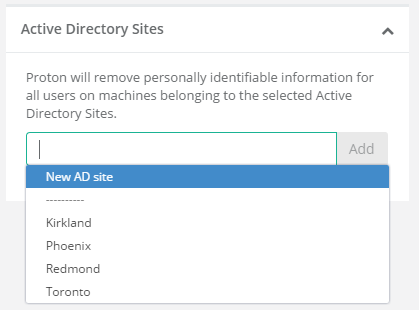 {width=“2.150472440944882in” height=“1.5910400262467193in”}
Add multiple IP address ranges by clicking the ‘Add Range’ button.
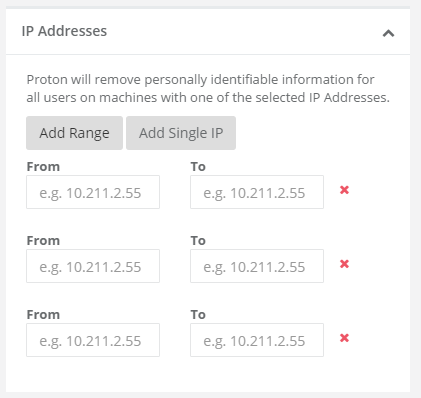 {width=“2.3675196850393703in” height=“2.238176946631671in”}
Diagnostics Page
Section titled “Diagnostics Page”The Diagnostics page provides administrators with information on the internal health of the Proton system and processes. This data is useful for administrators to review for troubleshooting and may be required when contacting Browsium support.
{width=“6.070701006124234in” height=“2.0598873578302714in”}
The System Control value on the diagnostics page is a global setting to enable or disable BCMS. If set to Disable, both the BCMS and Proton systems will not work as expected.
Value Description
Contact the Cloud Licensing Service The BCMS server routinely connects to the Browsium Cloud Licensing Service to validate the licenses assigned to your organization. No company or system configuration information is transmitted. This connection is done to ensure licenses remain valid and seat counts are properly implemented.
Data retention The data retention process is set by default to run at midnight each night. This item shows the status of the data retention enforcement and cleanup process.
Expire seat reservations Client machines that do not report or connect to the BCMS server on a regular basis will have their license seat reservations expired. This is done to ensure retired systems are removed from license seat counts, as well as ensure accurate accounting is maintained on a regular basis.
Process incoming activities Proton performs regular indexing and aggregation of incoming client data. This item shows if the aggregation process is performing properly or if maintenance or intervention is needed to correct a system error condition.
Rule mapping As needed, customers can modify and re-sort the Proton rules. When the rule structure is modified, Proton processes the new ordering and re-indexes (as needed) the dataset. This value shows the status and health of that process.
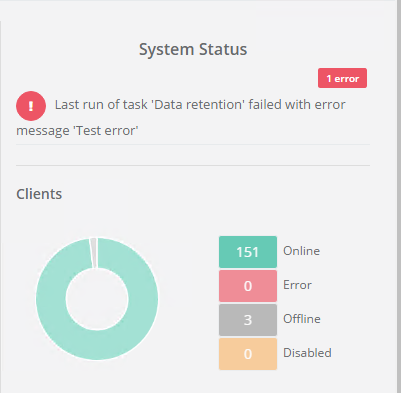
Section titled “Rule mapping As needed, customers can modify and re-sort the Proton rules. When the rule structure is modified, Proton processes the new ordering and re-indexes (as needed) the dataset. This value shows the status and health of that process.”When an error condition occurs, the task switches to status Error. The task will remain in status Error until the task runs again without triggering an error. However, the Last Error Message will remain indefinitely, so BCMS and Proton administrators can see the most recent error, even if status returns to OK**.** The Last Error Message can be cleared from the Diagnostics display via the green “Clear last error” button. However, all errors are written to the Browsium log in Event Viewer so you can retain a copy for future troubleshooting.
 {width=“6.5in” height=“0.5694444444444444in”}
When a task has an active error, you’ll also see the status on the Proton Dashboard in the System Status section.
 {width=“3.079288057742782in” height=“3.017856517935258in”}
**
 {width=“0.9194444444444444in” height=“0.9194444444444444in”}Section Four
Proton Tutorial
In this section, you will learn:
- Best practices for configuring your Proton Server